Modern repeated measures analysis using mixed models in SPSS (1)

preview_player
Показать описание
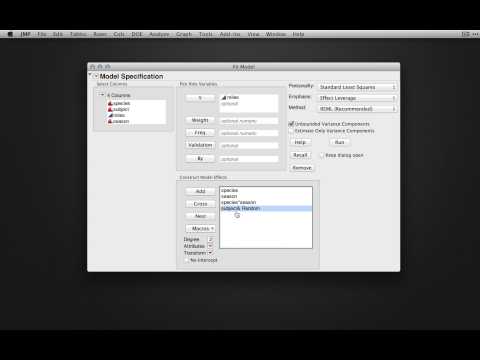
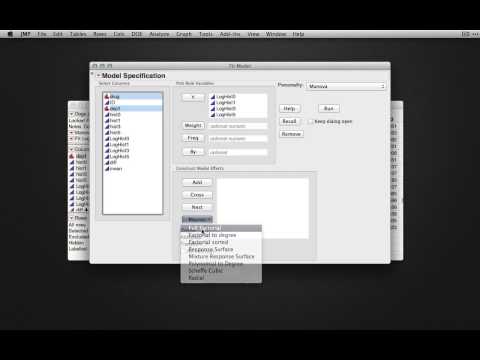
Repeated measures analyse an introduction to the Mixed models (random effects) option in SPSS. Demonstrates different Covariance matrix types & how to use the Likelihood ratio test to evaluate different models.

Robin Beaumont
Full notes, MCQ's etc at:

Рекомендации по теме
Комментарии
Автор

Thank you for posting this. Do you happen to have an example of a mixed-factor analysis (e.g., comparing two treatments over time)?

dtolin
Автор

Hello, is mixed model a parametric or a non-parametric analysis? In other words can I use it when my data is not normally distributed?

augustus
Автор

These videos are great. They are really, really help-full. Thanks.

Umar Alhaji

umaralhajiabubakar
Автор

Hi, how do you compare repeated measures with missing data?

TommasoMazza
Автор

at 8:46 the table with Covariance matrixes. Is there an error? with "Diagonal" there should be "No correlation (i.e. independent)" in the last column. If I compare that with the IBM SPSS documentation.

dirkschomburg
Автор

sorry it is me again, i have a data with one withing group IV with 3 levels  and one between group iv (which is a continuous variable) and i need to do repeated measures regression, this tutorial covers what do with the within group IV, how should I handle the between group iv in the mixed model? is there a tutorial for that in your link? Thank you for your help again.

bhattacc
Автор

I have one question. I did an analysis of a 2x2x2x2 factorial anova. The first 3 variables were repeated measures and the last was a between groups analysis. The data in the repeated measures were all reaction speeds. The names of variables were Zoom, Movement, Emotion and Orientation(between).

I found two statistical significant interactions between Movement and Emotion, and Zooming and Orientation. Now i want to examine in both interactions which pair of means were statistically different. But I can't do that in the Movement xEmotion interaction with a simple t-test because my dataset has 8 variables and not 4. Also how do I do it in the Zooming x Interaction?

nikoschristodoulakis
Автор

This is really helpful.
Can you show a 3-way mixed effects model please?
For example:
IV1 = Gender (btw)
IV2 = Time (before or after learning)
IV3 = Type of learning (with say, 5 levels)
DV = recall

ruslanvolkonsky
Автор

Thank you. How can i control confounding variables with Generalized estimated equations analyses?

saho
Автор

Hi Robin, Thank you for this clear video. I have a question about the modeling of change scores. I want to compare change in the dependent variable between two groups and they differ in baseline scores. Do I have to control for this difference, or does MLL account for it automatically. I thought that it accounts for this change as it models change withing groups and compares this change between groups but now I'm confused. Can you help me? Anyway, many thanks.

qwertY
Автор

This is by far the best explanation of mixed models I've seen online. I'm regressing a repeated measures continuous IV on a continuous DV and would like to make predictions, thus I need the regression equation and (ideally) the R2. Can I use the mixed model to get this?

thomasp
Автор

Hi,

I would like to ask about the model comparison at the end of the video. What is the interpretation of 1-pchisq (= 96)? Is it that 96 of 100 times the models would be equal in fitting or that 1 of 96 is different? So if the first is true, than the 1-pchisq should be higher thand 0.95 to conclude equality, right? In the second case (1 of 96 different) it schould be huigher than 20 (giving 95%). Thank you! M.

Makroragerovia
Автор

thank you so much I have the same question as Sarah garner

bhattacc
Автор

can u show how to do 2x2x8 mixed design anova please.

zubinbhavsar
Автор

there is an example just like this as part of the SPSS mixed models tutorials.

RobinBeaumont
Автор

Hello there, thank you for this really useful video. I am trying to run this analysis myself, however I have the equivalent of 3 time points (instead of your 2). Would you be able to explain how to do this? Thank you.

wifflek
Автор

Would you do an example where apply mixed model to marketing activity...for instance, to find the coefficient for a total sales of a company which is dependent on some stores and these stores sell five of the company's products..highly appreciated!!

bachadega
Автор

Hi chandrima 
I would suggest that you have a look at the book Linear Mixed models by West, Welch and Gatecki - 2nd ed. (2014) this has a example of what you want in it - I assume you are using R

RobinBeaumont
Автор

Hi Robin,
This is a great video, thanks for sharing your knowledge with us.
What are the references you have used to explain the choice for the covariance matries for repeated measures?

brunomazuquin
Автор

Very nice series. I wonder if you'd be interested in doing a similar set of videos for binary or count outcomes? Thanks again.

pal