filmov
tv
The Volatility Smile and Skew

Показать описание
★★ Save 10% on All Quant Next Courses with the Coupon Code: QuantNextYoutube10 ★★
★★ For students and graduates, we offer a 50% discount on all courses, please contact us if you are interested ★★
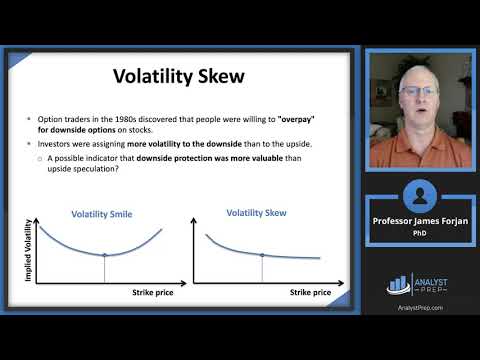
In this video we will look at the volatility smile and discuss the implied volatility shape coming from options on the same underlying asset, that have the same maturity date, but have different strike prices.
We will see that before October 1987 market crash the volatility curve was actually flat. Market participants started to price after the crash that the geometric Brownian motion assumption for the dynamic of stock prices was not true, stocks can jump and their distributions are fat-tailed.
0:00 Introduction
0:19 The Volatility is assumed Constant in Black-Scholes Model...
0:42 ... This is Not True in Practice
1:33 S&P Implied Volatility Before and After 1987 Market Crash
1:45 S&P Daily Returns Are Fat-Tailed
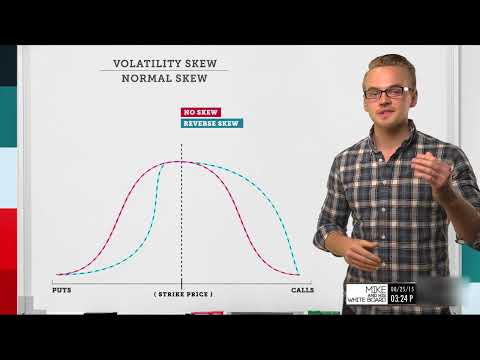
2:30 The Volatility Smile...
3:36 ...and Skew
#optionpricing, #quantitativefinance, #financeeducation, #derivatives, #quant, #quantnext
★★ For students and graduates, we offer a 50% discount on all courses, please contact us if you are interested ★★
In this video we will look at the volatility smile and discuss the implied volatility shape coming from options on the same underlying asset, that have the same maturity date, but have different strike prices.
We will see that before October 1987 market crash the volatility curve was actually flat. Market participants started to price after the crash that the geometric Brownian motion assumption for the dynamic of stock prices was not true, stocks can jump and their distributions are fat-tailed.
0:00 Introduction
0:19 The Volatility is assumed Constant in Black-Scholes Model...
0:42 ... This is Not True in Practice
1:33 S&P Implied Volatility Before and After 1987 Market Crash
1:45 S&P Daily Returns Are Fat-Tailed
2:30 The Volatility Smile...
3:36 ...and Skew
#optionpricing, #quantitativefinance, #financeeducation, #derivatives, #quant, #quantnext
 0:04:31
The Volatility Smile and Skew
 0:23:35
Options Strategies – Part III: Volatility Skew and Smile, and Strategies (2025 Level III CFA® – R7)...
 0:10:43
Volatility Skew Explained | Options Trading Concepts
 0:15:29
Volatility Smile and Skew | FRM Part 2 | Market Risk
 0:14:14
The Volatility Smile - Options Trading Lessons
 0:12:44
Volatility Surface & Volatility Smile Explained
 0:21:25
Level III: VOLATILITY SKEW AND SMILE
 0:16:40
Implied Volatility Skew & Three Things it Can Tell You
 0:07:48
How to beat Market Makers || Volatility Smile and Put-Call Parity Explained
![[CFA3] Module 8.11](https://i.ytimg.com/vi/K4xrMB0B-QY/hqdefault.jpg) 0:11:33
0:11:33
[CFA3] Module 8.11 Option Strategies: Volatility Skew and Smile
 0:05:39
Bitcoin's Volatility Smile and Skew: Unlocking the Secrets of Options Trading
 0:05:13
Volatility Skew Secrets | 2x Your Accuracy | Equityincome
 0:03:40
Why there is volatility smile and volatility skew
 0:35:38
The Ultimate Guide To Option Skew & Volatility Smile - Show #137 - Option Alpha Podcast
 0:04:32
Understanding Volatility Skew/Smile
 0:35:08
Implied Volatility, Volatility Skew, and the Term Structure of Volatility
 0:13:19
Volatility Skew Vs Smile!!! & various Option Volatility Trading Strategies
 0:07:47
Volatility Smile
 0:09:18
Volatility Skew Simplified #optionstrading #nse
 0:09:22
Explaining the Volatility Smirk
 0:04:36
GVol: Explaining Option Skew
 0:37:09
Volatility Smiles (FRM Part 2 2025 – Book 1 – Chapter 15)
 0:05:00
Implied volatility | Finance & Capital Markets | Khan Academy
 0:05:46
The Term Structure of Volatility and the Volatility Surface
Комментарии