filmov
tv
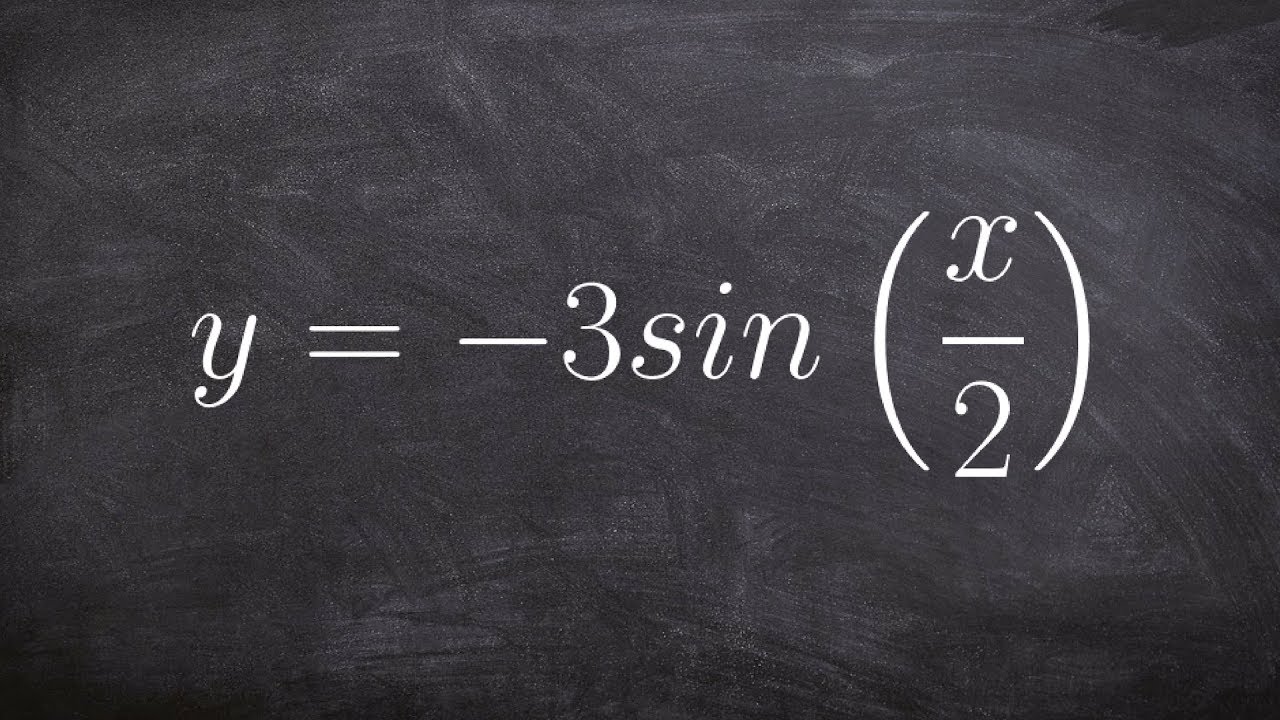
Learn How to Graph the Sine Function with a Reflection
Показать описание
👉 Learn how to graph a sine function. To graph a sine function, we first determine the amplitude (the maximum point on the graph), the period (the distance/time for a complete oscillation), the phase shift (the horizontal shift from the parent function), the vertical shift (the vertical shift from the parent function) and the x-scale (the distance between the turns and the x-intercepts). After we have obtained these features, we plot the points on the graph and graph accordingly.
Organized Videos:
✅ How to Graph Trigonometric Functions
✅ How to Graph Tangent | Learn About
✅ How to Graph Secant | Learn About
✅ How to Graph Sine and Cosine | Learn About
✅ How to Graph Trigonometric Functions | Learn About
✅ How to Graph The Sine Function
✅ How to Graph The Cosine Function
✅ How to Graph The Tangent Function
✅ How to Graph The Cotangent Function
✅ How to Graph Cosecant Function
✅ How to Graph The Secant Function
Connect with me:
#trig #graphing #brianmclogan
 0:00:46
How to draw graph of the Linear Equation y=2x+3 #math #tutor #mathtrick #learning #shorts #graph
 0:03:46
How to Graph Lines in Slope Intercept Form (y=mx+b)
 0:16:26
Introduction to Graph Theory: A Computer Science Perspective
 0:05:33
Learn to graph a line in slope intercept form
 0:07:32
Learn how to graph a quadratic
 2:12:19
Graph Algorithms for Technical Interviews - Full Course
 0:08:56
How to Graph Linear Relations Grade 9 Academic
 0:05:07
Learn how to graph a linear inequality
 0:00:12
LINE GRAPH!!😍 #line #linegraph #graph #maths #learnmaths #mathstipsandtricks #shorts
 0:19:52
Practical Physics (PHY 107): How to Plot a Graph Within 5 Minutes
 0:14:28
Graph Neural Networks - a perspective from the ground up
 0:05:36
What is a Knowledge Graph?
 0:11:05
How to graph a rational function using 6 steps
 0:02:16
Learn to Use Graph Editor - Alight Motion Tutorial
 0:07:05
How To Graph Linear Inequalities In Two Variables - Basic Introduction, Algebra
 0:04:55
How do find the x and y intercepts and graph
 0:02:41
Find the slope of a graph
 0:12:03
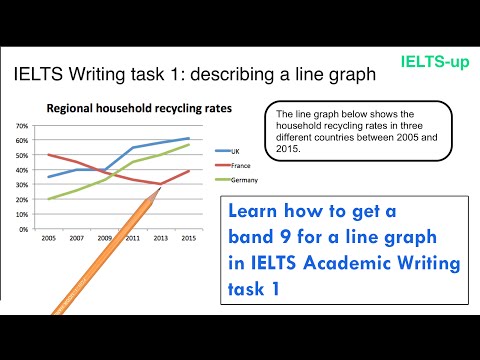
IELTS Writing task 1: line graph
 0:08:35
The ultimate intro to Graph Neural Networks. Maybe.
 0:04:09
Given fx sketch the first and second derivative graph
 0:04:15
Find the Domain and Range from a Graph
 0:10:05
How To Find The Equation of a Line From a Graph | Algebra
 0:10:57
How to Graph a Quadratic and Find Intercepts, Vertex, & Axis of Symmetry!
 0:05:25
How to Make a Line Graph in Excel
Комментарии