filmov
tv
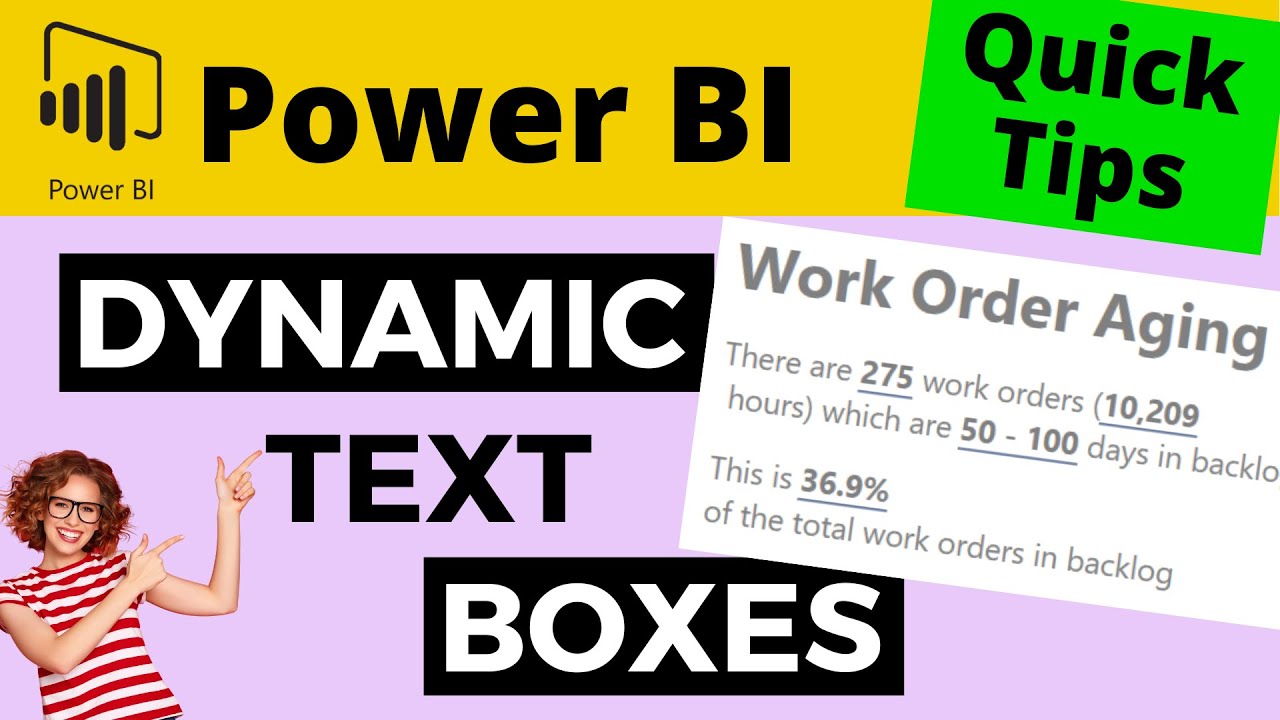
QT#66 - Integrate Measures Into the Standard Power BI Text Box to Create Dynamic Titles
Показать описание
In this video you'll learn how simple it is to integrate measures into the standard Power BI text box to create dynamically updated text in your report pages.
It's super easy to embed your measure into the text box, allowing you to integrate them into descriptions and narratives. Then, like in all Power BI visulisations, the values will change depending on the filter context applied to the visual.
This approach is great for report page titles or stand lone text boxes where you want to add a dynamic summary of the information displayed. This could be useful if your report page is part of a report or even embedded into had PowerPoint presentation. See the link below to my video on embedding Power BI into Power Point.
----------------------------------
⏩ Video Navigation
----------------------------------
00:00 - Introduction
00:40 - Adding Dynamic Value to the Text Box
02:05 - Modifying formatting in Text Box
03:00 - Adding a More Dynamic Values
04:45 - Formatting Number of Decimal Places Displayed
06:00 - Summary of Dynamic Text
-----------------------------------------------------
🎥 Related Videos
-----------------------------------------------------
QT#64 - How to Embed Power BI Reports into PowerPoint + Create Monthly Maintenance Report Template
-----------------------------------------------------
🎓 Power BI Dashboard Training
-----------------------------------------------------
👉FREE Power BI Quick Start Course - Learn how to create your first dashboard in around 90 minutes!
👉 Power BI Quick Start PLUS - Learn how to craft KPI management dashboards that really do help you, your boss, and your peers make better decisions!
-------------------------
📁 Resources
-------------------------
👉Access to the source PBIX files for my YouTube videos:
👉Article series on creating a maintenance management system data model and how to address the human factors of data collection for improved data quality. (This is not just relevant to maintenance and reliability data).
 0:07:04
QT#66 - Integrate Measures Into the Standard Power BI Text Box to Create Dynamic Titles
 0:10:21
QT#75 - Add Conditional Formatting to Values INSIDE a Power BI TEXT BOX
 0:00:16
Pakistan education system what a beautiful environment WOW🤣🤣
 0:03:50
Power BI used dynamic measure in Textbox
 0:00:16
Describe your perfect vacation. #philippines #angelescity #expat #travel #filipina #phillipines
 0:10:16
CUSTOM Dynamic text boxes in Power BI
 0:06:24
How To Create Text Summaries With Dynamic Measures Embedded Into The Description
 0:00:20
Erdoğan ile fotoğraf çektirmek isteyen Rıdvan Dilmen'i Emine Erdoğan kovdu: “Sen çekil oradan…”...
 0:03:57
Power BI DAX: A Joint Measure to concatenate different measures with ampersand (&) Operator
 0:00:59
Power BI - Create a Custom Sort Order of X-Axis Categories #shorts
 0:06:38
Measure Power Use with Eclipse IDE, Virtual Prototype running Embedded Linux
 0:11:45
Dynamic Title Names in Power BI using SelectedValue and Conditional Formatting
 0:11:42
NanoVNA-F length measurement of COAX & SWR for Antenna measurement
 0:13:29
Power BI Risk Management Dashboard - S1 - V1.7 - Adding Risk Grouping
 0:00:15
Please Subscribe to my channel❤️ #shorts #youtubeshorts #shortsfeed #roadto1ka.
 0:41:28
Qt Design Best Practices
 0:11:43
TE's Raychem Cold Shrink Disconnectable Joint Installation Video
 0:05:58
Learn how to create Dynamic Titles in PowerBI | MITutorials
 0:00:36
Beautifying Your Power BI Reports Lesson #1: Unified Fonts
 0:05:45
Power BI Dynamically Change X axis using Field Parameter | How to use Field Parameter in Power BI
 0:21:18
Car Infotainment Systems Power Design Series (5): Automotive USB-C charging systems
 0:15:51
Hands-on LTE Antenna Integration
 0:04:28
POWER BI TUTORIAL 2023 | Implement PARETO PRINCIPLE in POWER BI - (PART2)
 0:06:04
Bold, italic, underlined or strikethrough text in Power BI? No problem! ✔
Комментарии