filmov
tv
Logistic Regression Using Excel
Показать описание
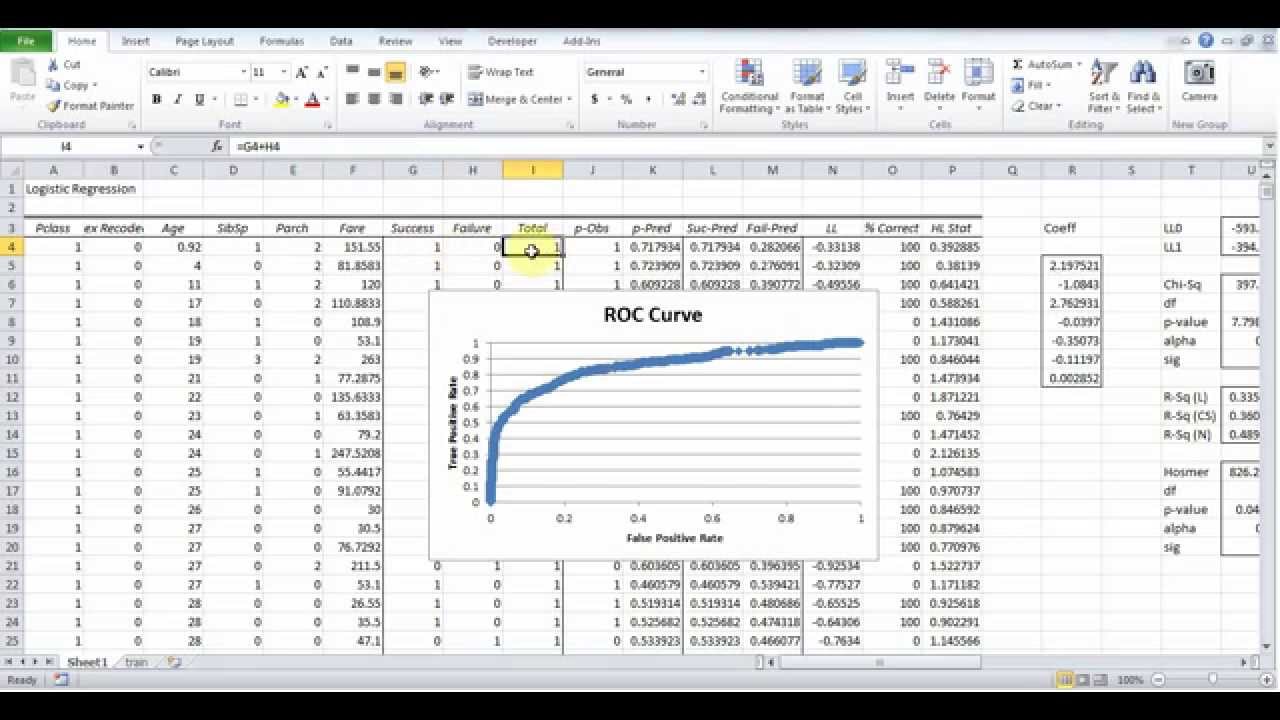
Predict who survives the Titanic disaster using Excel.
Logistic regression allows us to predict a categorical outcome using categorical and numeric data. For example, we might want to decide which college alumni will agree to make a donation based on their age, gender, graduation date, and prior history of donating. Or we might want to predict whether or not a loan will default based on credit score, purpose of the loan, geographic location, marital status, and income. Logistic regression will allow us to use the information we have to predict the likelihood of the event we're interested in. Linear Regression helps us answer the question, "What value should we expect?" while logistic regression tells us "How likely is it?"
Given a set of inputs, a logistic regression equation will return a value between 0 and 1, representing the probability that the event will occur. Based on that probability, we might then choose to either take or not take a particular action. For example, we might decide that if the likelihood that an alumni will donate is below 5%, then we're not going to ask them for a donation. Or if the probability of default on a loan is above 20%, then we might refuse to issue a loan or offer it at a higher interest rate.
How we choose the cutoff depends on a cost-benefit analysis. For example, even if there is only a 10% chance of an alumni donating, but the call only takes two minutes and the average donation is 100 dollars, it is probably worthwhile to call.
 0:07:55
Logistic Regression Using Excel
 0:09:47
Logistic Regression using EXCEL
 0:05:33
Logistic Regression in Excel
 0:17:59
Logistic Regression for Excel
 0:18:28
Logistic Regression Using Excel Video 1 (Finding Heart Disease Probabilities)
 0:08:00
Logistic Regression Using Excel Solver
 0:21:17
Logistic Regression in Excel
 0:02:03
Excel Logistic Regression using XLMiner ToolPak AddIn
 1:54:35
ChatGPT for Data Science: Complete A-Z Guide 2024 | Master AI in Data Analytics #chatgpt #course
 0:09:03
Logistic Regression using Solver
 0:04:49
Binary Logistic Regression
 0:24:19
Logit model explained: regression with binary variables (Excel)
 0:05:53
Logistic Regression in Excel
 0:10:27
Logistic Regression using excel
 0:14:22
Logistic Regression [Simply explained]
 0:15:32
Logistic Regression for Excel
 0:16:38
Logistic Regressions in Excel
 0:06:24
How to fit non-linear equations in excel using solver
 0:06:13
Logistic Regression using Excel (Solver)
 0:15:30
Predictive Stepwise Logistic Regression for Excel
 0:19:32
Logistic Regression Using Excel Video 2 - Predicting Heart Disease Probabilities
 0:16:27
Logistic Regression using Excel
 0:10:14
Interpreting Logistic Regression Using Excel
 0:16:46
How to select predictor when we use the Logistic Regression using Excel
Комментарии