filmov
tv
EEG Spectrogram: A Python Flask EEG Analysis Tool Development - Part 3
Показать описание
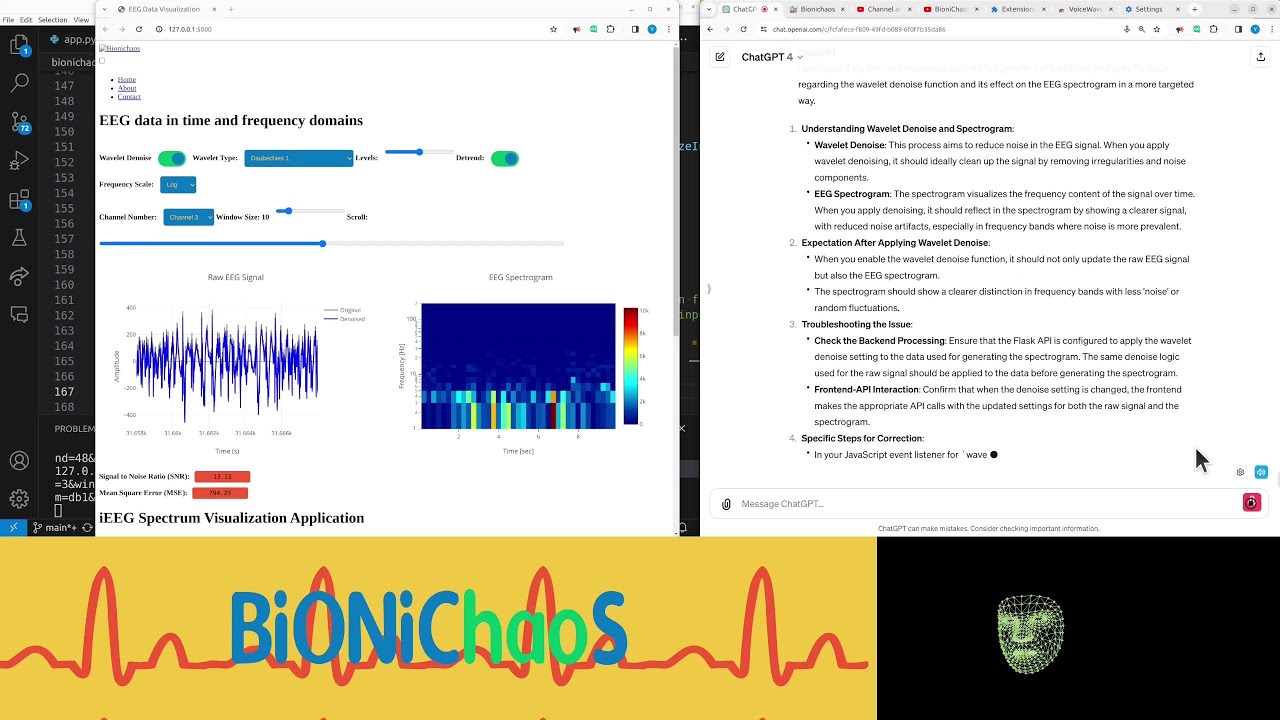
In this video, I demonstrate a web application designed for EEG (Electroencephalogram) data visualization. The application features a spectrogram that displays seizures on different channels. I showcase how the application defaults to a 10-second display, which can be adjusted, and discuss the benefits of using a logarithmic scale for better detail in lower frequency components. I also delve into the functionality of the wavelet denoising feature and its impact on the EEG signal and spectrogram.
Throughout the video, I explore the code behind the application, focusing on the use of the Plotly library for graph rendering and Flask for backend data fetching. I address specific issues, such as the need to update the EEG spectrogram in response to changes in wavelet denoising settings. By examining the JavaScript code, I demonstrate how user interactions with sliders and toggles can dynamically update EEG signal visualizations in real-time.
Timestamps:
(00:00) Introduction and overview of the EEG data visualization application
(00:31) Discussion on logarithmic vs. linear scale
(01:03) Reviewing and understanding the provided code
(02:01) Detailed explanation of the EEG web application's HTML and JavaScript code
(03:37) Identifying and addressing issues with wavelet denoising and spectrogram updates
(05:17) In-depth analysis of the wavelet denoising function and its impact on the EEG spectrogram
(06:24) Implementing changes to update the spectrogram based on denoising settings
I use GitHub Copilot and ChatGPT for development.
 0:01:33
 0:07:03
 0:07:39
 0:16:24
 0:23:03
 0:32:08
 0:30:42
 0:26:22
 0:50:36
 0:21:33
 0:12:44
 0:26:57
 0:41:05
 0:02:00
 1:11:43
 0:56:30
 0:11:16
 0:02:57
 1:16:07
 1:55:39