filmov
tv
t Distribution and t Scores in R | R Tutorial 3.4 | MarinStatsLectures

Показать описание
In this video, you will learn how to calculate probabilities and find quantiles (or critical values) for the student t distribution in statistics using R. We will present the pt, dt and qt functions in R programming language.
This video is a tutorial for programming in R Statistical Software for beginners, using RStudio.
►► Watch More:
Follow MarinStatsLectures
Our Team:
Content Creator: Mike Marin (B.Sc., MSc.) Senior Instructor at UBC.
Producer and Creative Manager: Ladan Hamadani (B.Sc., BA., MPH)
These videos are created by #marinstatslectures to support some statistics courses at the University of British Columbia (UBC) (#IntroductoryStatistics and #RVideoTutorials ), although we make all videos available to the everyone everywhere for free.
Thanks for watching! Have fun and remember that statistics is almost as beautiful as a unicorn!
#statistics #rprogramming
 0:04:08
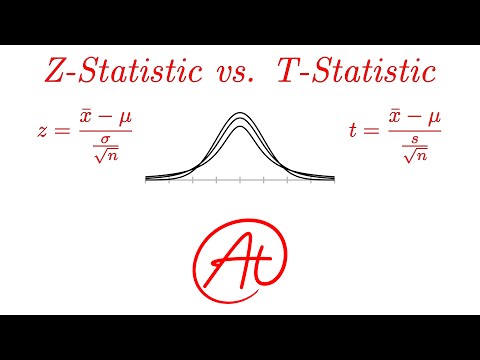
Z-Statistics vs. T-Statistics EXPLAINED in 4 Minutes
 0:08:54
Introduction to the t Distribution (non-technical)
 0:04:19
t Distribution and t Scores in R | R Tutorial 3.4 | MarinStatsLectures
 0:06:39
Z-statistics vs. T-statistics | Inferential statistics | Probability and Statistics | Khan Academy
 0:01:44
t critical value using the t-distribution table
 0:03:11
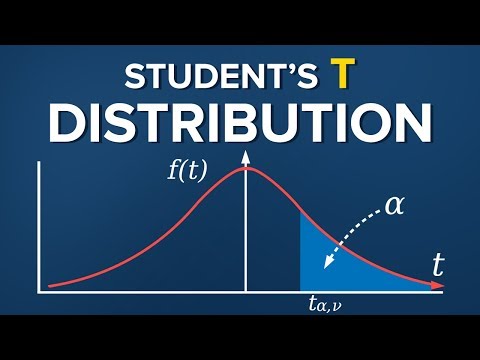
Student's T Distribution
 0:16:14
t-Test - Full Course - Everything you need to know
 0:20:49
What is the t-distribution? An extensive guide!
 1:24:27
Compare Means: One-Sample, Independent Sample, and Paired Sample t-Tests in Jamovi
 0:08:58
t-tests and p values
 0:17:40
Student's T Distribution - Confidence Intervals & Margin of Error
 0:02:34
How to Understand and Calculate a T-Score | Statistics
 0:10:11
Student's t-test
 0:01:33
t-Table - Intro to Inferential Statistics
 0:04:51
When to use z or t statistics in significance tests | AP Statistics | Khan Academy
 0:02:56
Student's t-Distribution
 0:13:34
Hypothesis Testing Problems - Z Test & T Statistics - One & Two Tailed Tests 2
 0:05:28
Practical Application of the Normal Distribution, T-scores, Percentile rank
 0:04:26
Find T Score(T Value) from T Table for Confidence Interval
 0:04:19
t Distribution and t Scores in R
 0:11:17
T-Tests: A Matched Pair Made in Heaven: Crash Course Statistics #27
 0:03:42
Introduction to T scores Standard
 0:07:40
Confidence Interval for a population mean - t distribution
 0:05:18
Intro to the t Distribution (non-technical)
Комментарии