filmov
tv
Creating a heatmap map with geom_tile from ggplot2 in R (CC258)

Показать описание
Pat shares how to create a world-wide map of precipitation data as a heatmap using the geom_tile function from ggplot2. To generate the final figure he is plotting the z-score of monthly precipitation for each longitude and latitude relative to the precipitation over the past 30 days for each long and lat combination. The overall goal of this project is to highlight reproducible research practices using a number of tools including ggplot, geom_raster, geom_tile, scale_fill_gradient2, labs, theme, and more. The specific output from this project will be a map-based visual that shows the level of drought across the globe.
#geom_tile #Rstats #R
Support Riffomonas by becoming a Patreon member!
You can also find complete tutorials for learning R with the tidyverse using...
0:00 Introduction
2:44 Creating a heatmap with geom_tile
6:30 Modifying fill color gradient
10:16 Rescaling color gradient to increase contrast
13:51 Formatting and placing the legend
17:58 Saving and modifying appearance of visual
19:37 Adding dynamic titles
23:17 Updating snakefile and committing changes

How to Create a Heat Map with Excel

Create a Heat Map in Excel

Create a Custom Heat Map

Creating points and heatmap from CSV without coding

How To: Create an Excel Risk Heatmap

Big Heatmap Tutorial | Maplibre, Mapbox, Leaflet, Google Maps | Proximity, Weighted, and Cell

Creating a Heatmap in Excel

Creating a Heatmap in QGIS - Heatmap Tutorial

Create a Heatmap using Seaborn

ArcGIS Pro - Creating a Heatmap based on Crash Data

How to Create a UK County Heatmap in Excel

Create Heatmap in Tableau Easy! #tableau

How to Create a Heatmap in Excel (THE EASY WAY)

How To Create A Heat Map In GraphPad Prism

Creating a heatmap map with geom_tile from ggplot2 in R (CC258)

Seaborn heatmap | How to make a heatmap in Python Seaborn and adjust the heatmap style
How to make a heatmap in Excel! #exceltips #tutorial

Create a Geographic Heat Map

What is a Heatmap?

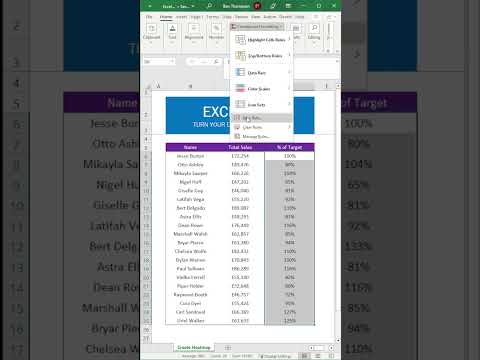
How to build a heat map🔥 in #excel #heatmap #exceltipstricks #learnexcelin2022

What is the best heatmap software? . . .
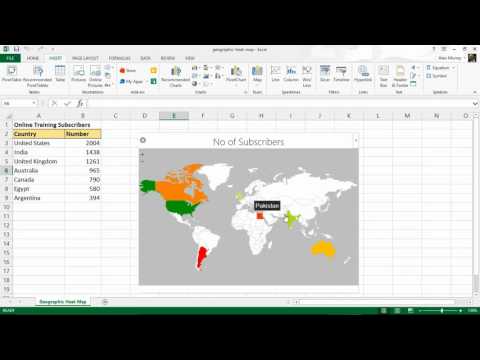
Create a Geographic Heat Map in Excel with a Free Add-In

Excel heatmap

How to interpret a heatmap for differential gene expression analysis - simply explained!
Комментарии