filmov
tv
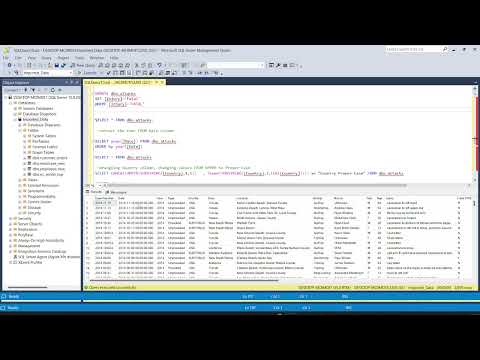
Mastering SQL for EDA : A Comprehensive SQL Project Guide with Queries

Показать описание
Welcome to our in-depth tutorial on analyzing NFT transactions using SQL! In this video, we’ll walk you through several powerful SQL queries to extract and analyze data from our NFT transaction dataset. By the end of this video, you’ll have a solid understanding of how to manipulate and gain insights from your data.
*Here’s what we’ll cover:*
1.) 🔗 Overview of the NFT Dataset:
2.) 📊 Total sales in the given time period.
3.) 💸 Top 5 highest transactions (USD): name, ETH price, USD price, date.
4.) 📈 Transaction table: event, USD price, 50-transaction moving average.
5.) 💰 NFT names with average USD sale price (descending order).
6.) 📅 Day of the week: number of sales and average ETH price, ordered by transaction count.
7.) 📝 Transaction summary: seller, buyer, NFT name, date, and rounded USD price.
8.) 👤 View of sales with “0x1919db36ca2fa2e15f9000fd9cdc2edcf863e685” as buyer.
9.) 📉 Histogram of ETH price ranges (rounded to nearest hundred).
10.) 🔀 Union query: highest and lowest NFT purchase prices with status.
11.) 🏆 Most sold NFT each month/year with name and USD price (chronological order).
12.) 📅 Monthly total volume of sales (rounded to nearest hundred).
🔍 Estimated average value calculator: daily representative price excluding outliers.
For the steps in creating the "estimated average value calculator":
a.) 🗂 Subquery: event date, USD price, average USD price (daily) in a temporary table.
b.) 🧮 Filter subquery: exclude USD prices below 10% of daily average, return new estimated daily average.
⏰ * Time Stamp: *
00:00 📝 Overview and Objective SQL Project
01:20 📊Total sales in the given time period
01:48 💸Top 5 highest transactions (USD): name, ETH price, USD price, date
02:50 📈 Transaction table: event, USD price, 50-transaction moving average
06:25 💰 NFT names with average USD sale price (descending order)
07:50 📅 Day of the week: number of sales and average ETH price, ordered by transaction count
12:25 📝 Transaction summary: seller, buyer, NFT name, date, and rounded USD price
15:50 👤 View of sales with “0x1919db36ca2fa2e15f9000fd9cdc2edcf863e685” as buyer
17:45 📉 Histogram of ETH price ranges (rounded to nearest hundred)
19:45 🔀 Union query: highest and lowest NFT purchase prices with status
22:15 🏆 Most sold NFT each month/year with name and USD price (chronological order)
28:05 📅 Monthly total volume of sales (rounded to nearest hundred)
30:00 🔍 Estimated average value calculator: daily representative price excluding outliers
💸 *SQL Queries and Data Repository:*
Find the complete Queries and Data used in this video on our GitHub repository
 0:34:31
Mastering SQL for EDA : A Comprehensive SQL Project Guide with Queries
 0:01:00
Mastering Rolling Sums in SQL for Exploratory Data Analysis
 5:09:57
Learn Exploratory Data Analysis (EDA) from Scratch | EDA in 5 hours | Satyajit Pattnaik
 0:01:00
Data Science Roadmap 2024: From Beginner to Expert in 6 Steps
 0:00:45
How I'd Learn PYTHON For DATA ANALYSIS | If I Had To Start Over Again #dataanalyst #dataanalyti...
 0:19:04
Mastering Exploratory Data Analysis with SQL: 5 Essential Interview Questions Answered!
 0:00:28
Mastering Data Analysis: Your 6-month Roadmap To Success
 0:00:32
Today we completed the data cleaning, modeling and analysis task using mysql.
 0:15:41
How to become a Data Analyst FAST (By 2025)
 0:01:00
Analyzing Datasets with Window Functions: First Value Syntax and Examples
 0:00:22
Comment yes for more body language videos! #selfhelp #personaldevelopment #selfimprovement
 0:14:33
Mastering Business Intelligence with Pandas: Using SQL-like queries to Answer Business Questions
 1:53:42
Masterclass Event - Mastering Exploratory Data Analysis in 2023: Key to success in Data Science
 0:15:54
Data Wrangling and cleaning | SQL for Beginners
 0:33:44
𝐂𝐥𝐚𝐬𝐬 𝟔 :𝐃𝐚𝐭𝐚 𝐂𝐨𝐥𝐥𝐞𝐜𝐭𝐢𝐨𝐧- 𝐂𝐒𝐕, 𝐀𝐏𝐈, 𝐒𝐐𝐋 | 𝐏𝐲𝐭𝐡𝐨𝐧 𝐋𝐢𝐛𝐫𝐚𝐫𝐢𝐞𝐬 |𝐏𝐲𝐭𝐡𝐨𝐧 𝐄𝐃𝐀 𝐅𝐮𝐥𝐥 𝐂𝐨𝐮𝐫𝐬𝐞 | 𝐃𝐚𝐭𝐚 𝐀𝐧𝐚𝐥𝐲𝐬𝐢𝐬...
 0:12:45
How to do SQL | Mastering Data Cleaning in SQL: A Comprehensive Guide
 0:17:25
eda techniques in data science | Simple way to practice EDA
 1:01:50
Walmart Sales Data Analysis With MySQL | MySQL Protfolio Project
 0:01:00
Data Structures in #python #coding
 1:24:42
Day-10: Mastering Pandas Library and EDA (Part-3)
 0:10:17
Best Data Analyst Learning Resources in 2024-25
 1:04:25
Day-9: Mastering Pandas Library and EDA (Part-2)
 0:40:01
Real World Data Cleaning in Python Pandas (Step By Step)
 5:24:31
Python for Data Science Course – Hands-on Projects with EDA, AB Testing & Business Intelligence...
Комментарии