filmov
tv
Visualizations in Power BI - Full Tutorial

Показать описание
✅ Download the free course demo files to follow along
Power BI is a powerful Business Intelligence software that provides interactive visualizations, and in this video tutorial, we will explore visualizations in Power BI as this is what Power BI is all about.
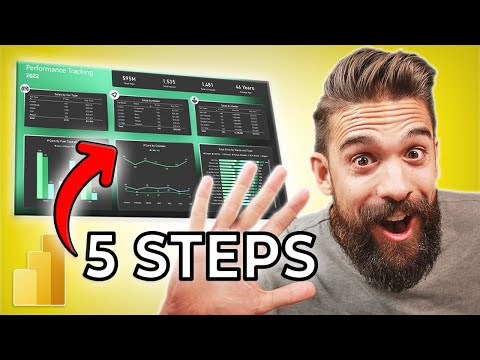
We start this tutorial off by giving you tips on how to look at data to decide what is of importance to show in a visualization. We then talk about the difference between a Table and a Matrix Table visualization and the formatting options in Power BI. We teach you how to apply formatting to visualizations including applying conditional formatting. You will also learn how to create Column Charts, Line Charts, and Map Charts in Power BI.
The second half of this tutorial will teach you how to use Gauge Visualization and Card Visualization in Power BI, which are commonly used to emphasize key report metrics. We round off this video by showing how to add Power BI Slicers and Filters and which design elements you can change in your report such as fonts, colors, etc.
We've even included downloadable course files so you can follow along in this course. This will help you put what you are learning into practice, and master visualization in Power BI.
📝 Use the timestamps below to navigate to different sections of the course. If you already know one of these topics, skip ahead!
0:00:00 - Visualizations
0:08:49 - Tables vs. Matrix Tables
0:15:15 - Formatting Visualizations - Part 1
0:22:01 - Formatting Visualizations - Part 2
0:25:07 - Conditional Formatting
0:37:49 - Column and Line Charts in Power BI
0:51:44 - Card Visualizations
0:57:35 - Map Charts
1:07:19 - Gauge Visualization in Power BI
1:16:57 - Slicers and Filters in Power BI
1:25:25 - Applying Design Elements
💻 Watch more free popular training tutorials from Simon Sez IT:
🔥Check out our FREE 300+ hour training course playlist here ➡️
💬Stay in touch!
🔔 Subscribe to our channel:
If you enjoyed the video, please give a thumbs up 👍🏽 ;-)
Power BI is a powerful Business Intelligence software that provides interactive visualizations, and in this video tutorial, we will explore visualizations in Power BI as this is what Power BI is all about.
We start this tutorial off by giving you tips on how to look at data to decide what is of importance to show in a visualization. We then talk about the difference between a Table and a Matrix Table visualization and the formatting options in Power BI. We teach you how to apply formatting to visualizations including applying conditional formatting. You will also learn how to create Column Charts, Line Charts, and Map Charts in Power BI.
The second half of this tutorial will teach you how to use Gauge Visualization and Card Visualization in Power BI, which are commonly used to emphasize key report metrics. We round off this video by showing how to add Power BI Slicers and Filters and which design elements you can change in your report such as fonts, colors, etc.
We've even included downloadable course files so you can follow along in this course. This will help you put what you are learning into practice, and master visualization in Power BI.
📝 Use the timestamps below to navigate to different sections of the course. If you already know one of these topics, skip ahead!
0:00:00 - Visualizations
0:08:49 - Tables vs. Matrix Tables
0:15:15 - Formatting Visualizations - Part 1
0:22:01 - Formatting Visualizations - Part 2
0:25:07 - Conditional Formatting
0:37:49 - Column and Line Charts in Power BI
0:51:44 - Card Visualizations
0:57:35 - Map Charts
1:07:19 - Gauge Visualization in Power BI
1:16:57 - Slicers and Filters in Power BI
1:25:25 - Applying Design Elements
💻 Watch more free popular training tutorials from Simon Sez IT:
🔥Check out our FREE 300+ hour training course playlist here ➡️
💬Stay in touch!
🔔 Subscribe to our channel:
If you enjoyed the video, please give a thumbs up 👍🏽 ;-)
 1:33:34
Visualizations in Power BI - Full Tutorial
 0:14:14
Popular Visualizations in Power BI | Microsoft Power BI for Beginners
 0:10:55
How To Create these useful Power Bi Visuals that Excel Lacks
 0:51:11
Charts & Visualizations in Power Bi | Full Tutorial | Power Bi| KSR DATAVIZON
 0:11:43
How to pick the 'perfect' chart for your situation in Power BI?
 0:20:22
5 DESIGN TRICKS that Make EVERY Power BI Report Look GREAT!
 0:23:03
Power BI Tutorial For Beginners | Create Your First Dashboard Now (Practice Files included)
 0:12:32
Power BI Tutorial for Beginners
 0:01:00
How to Become A Data Analyst: Master Storytelling With Data Using Tableau, Power Bi, Excel, Sql
 0:41:07
How to Build Power BI Reports from Start to Finish
 0:17:11
🚨 YOU'RE VISUALIZING YOUR DATA WRONG. And Here's Why...
 0:04:06
Use Custom Visuals in Power BI
 3:02:18
Hands-On Power BI Tutorial 📊 Beginner to Pro [Full Course] 2023 Edition⚡
 0:15:10
How to create Power BI Dashboard (Report) in 7 Minutes in Power BI Desktop | @PavanLalwani
 0:11:15
Your first 10 minutes of Power BI - A no-nonsense getting started tutorial for beginners
 0:00:27
Power BI - Matrix Visualization - move values from columns to rows
 0:33:24
Upgrade Your REPORT DESIGN in Power BI | Complete Walkthrough From A to Z
 1:01:09
Power BI Dev Camp: Developing Custom Visuals for Power BI
 4:28:30
[[ 4.5 HOURS ]] Complete Power BI Visuals / Charts / Dashboards - { End to End } Full Course
 0:16:21
Power BI Tips and Tricks
 0:07:26
Power BI #5 - Visuals in Power BI |Different Visuals| How to create Visualization?
 0:19:12
Create an Amazing Power BI Dashboard in 19 minutes | Amazon Prime Movies and TV Shows
 0:00:29
Demo of a Power BI 3D Visual - Architectural Planning Data
 0:04:41
How to Switch Visuals in Power BI with BUTTONS
Комментарии