filmov
tv
Linear Control Systems: How to draw Bode plot using semilog sheet: Solved Example to find GM and PM

Показать описание
This video illustrates the steps to draw Bode plot for a given Transfer Function and also explains how to find Gain Margin (GM) and Phase Margin (PM) and comment on the stability of the system.
Pls note that this video illustrates the straight line approximation of the bode plot.
Pls note that this video illustrates the straight line approximation of the bode plot.
 0:16:08
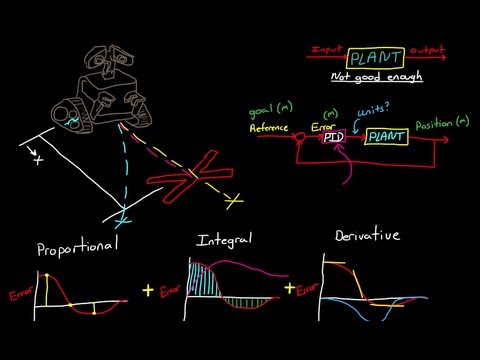
Everything You Need to Know About Control Theory
 0:10:44
Introduction to Control System
 0:10:07
What are Transfer Functions? | Control Systems in Practice
 0:07:27
Linear vs Non - Linear Control Systems | With Examples | Simplified KTU EC 409
 0:24:47
Linear Systems [Control Bootcamp]
 0:42:02
Control Systems. Lecture 1: Introduction to Linear Control Systems
 0:26:58
A real control system - how to start designing
 0:07:51
Control Systems Lectures - LTI Systems
 1:00:51
L-2 200 Practice Questions - Control Systems Part 2 | GATE ESE AE/JE | EC/EE/IN | Ankur Sharma Sir
 0:13:25
Linear and Non-Linear Systems
 0:06:05
Introduction to Transfer Function
 0:08:56
ECE320 Lecture1-1a: Introduction to Linear Control Systems
 0:07:19
Mathematical Model of Control System
 0:07:44
PID Control - A brief introduction
 0:14:01
What Is Linearization?
 0:14:21
What Control Systems Engineers Do | Control Systems in Practice
 0:00:07
Example of a Control System
 0:07:35
ECE320 Lecture1-1b: Introduction to Linear Control Systems
 0:05:50
Why Learn Control Theory
 0:08:21
Example on Routh Array Stable System
 0:17:24
What Is Linear Quadratic Regulator (LQR) Optimal Control? | State Space, Part 4
 0:00:12
Turret Control System (Double Worm Gear Mechanism Application)
 0:09:16
Problem 1 on Block Diagram Reduction
 0:13:30
A Conceptual Approach to Controllability and Observability | State Space, Part 3
Комментарии