filmov
tv
How to use Data Structures For Multiple Datasets in Chart js

Показать описание
How to use Data Structures For Multiple Datasets in Chart js
In this video we will cover how to use data structures for multiple datasets in chart js. Data structures are very powerful and with it we can create multiple datasets from a single data structure and display them at once.
This creates a very nice concise code without too much excess code. We will create 3 independent lines which are all stored in a single data structure. Giving them their own colors and extracting the specific values from the data structure.
Let's explore this right now!
▬ Chartjs Viewers Question Series ▬▬▬▬▬▬▬▬▬▬
This is part of the Chartjs Viewers Question series. Where we answer viewer questions. This question was asked by one of our viewers.
▬ Materials/References ▬▬▬▬▬▬▬▬▬▬
To keep the video short we might expect you to know parts. These parts we have explained in other videos. You can find the references here below:
▬ Got a Question? Comment! ▬▬▬▬▬▬▬▬▬▬
Got a question or special request about a specific item? Comment below and tell me your question. I will make sure to follow up on you!
▬ Find Me Here ▬▬▬▬▬▬▬▬▬▬
Chart JS tutorials for Beginners:
Chart JS tutorials for Intermediate:
Chart JS Dashboard Series:
👍 Most Liked Video Series:
▬ About Us ▬▬▬▬▬▬▬▬▬▬▬▬
Why we created these #chartjs and #javascript video tutorials?
WHY
Creating charts in javascript is very rewarding but extremely challenging. The Chart JS library made it easier to render charts. However the chart js documentation is hard to understand for many. It requires a lot of different moving parts to work along. The canvas tag, javascript, arrays and Chart JS all need to be combined to draw an eye catching bar chart or line chart.
The videos explains the chart js documentation in a more visual and easy to understand way. You can follow along with the code and quickly grasp how it works. We cover the code in chart js but also what truly happens and why something happens when we write a line of code. This fundamental understanding gives clarity to you as a developer in chartjs. In short it is the Chart JS video documentation.
HOW
We answer questions from YOU (viewers) by creating an answer video that covers the questions YOU have posted in the comment section.
WHAT
Our goal is to help YOU learn how to draw charts in Chart JS by showing you in video format how to do it.
▬ Chart JS 3.6.0 ▬▬▬▬▬▬▬▬▬▬▬▬
Chart JS is a javascript library to draw charts in the canvas tag on your site. Presenting data in a visual manner such as charts is more effective and appealing. All the charts are always coded in the latest Chartjs version which is as of this recording Chart JS 3.6.0.
What type of charts can you make with Chart.JS?
With chart js you can make line chart, bar chart, pie chart, doughnut chart, scatter chart, polar area chart, radar chart, gauge chart and area chart. And with some clever tricks and visual adjustment more can be done.
 0:17:06
Data Structures Explained for Beginners - How I Wish I was Taught
 0:08:43
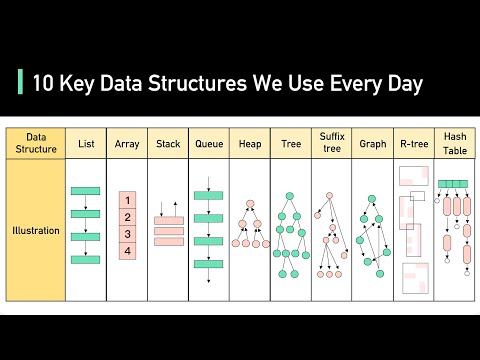
10 Key Data Structures We Use Every Day
 0:11:39
How Data Structures & Algorithms are Actually Used
 0:00:40
How I'd Learn Data Structures & Algorithms For Free
 0:15:10
How to ACTUALLY Master Data Structures FAST (with real coding examples)
 0:06:52
How does the SET data structure really work?
 0:06:25
Data Structures: Hash Tables
 0:08:42
Fastest way to learn Data Structures and Algorithms
 0:21:28
Day - 14 : Python Full Course In Telugu | Exploring Set Data Structure in Python | Ashok IT
 0:00:57
Visualize data structures and algorithms
 0:13:02
Top 7 Data Structures for Interviews Explained SIMPLY
 0:07:07
What are Data Structures?
 0:00:59
7 Data Structures that Every Programmers Must Learn || Programming #tutorial #beginners #python
 0:05:47
Data Structures & Algorithms Tutorial in Python #1 - What are data structures?
 0:01:00
Data Structures and Algorithms
 0:07:23
DATA STRUCTURES you MUST know (as a Software Developer)
 0:00:59
There is an Order to Learning Data Structures & Algorithms!!!
 0:00:49
Don’t learn Data Structure before knowing this ❌❌
 0:07:53
Do You Need To Learn Data Structures and Algorithms?
 0:17:09
8 Data Structures Every Programmer Should Know
 0:01:00
Best Order to Learn Algorithms & Data Structures
 0:04:43
Data Structures: When to use which data structure?
 0:05:10
Real Life Applications of Data Structures | Log2Base2
 0:10:45
How I Mastered Data Structures and Algorithms
Комментарии