filmov
tv
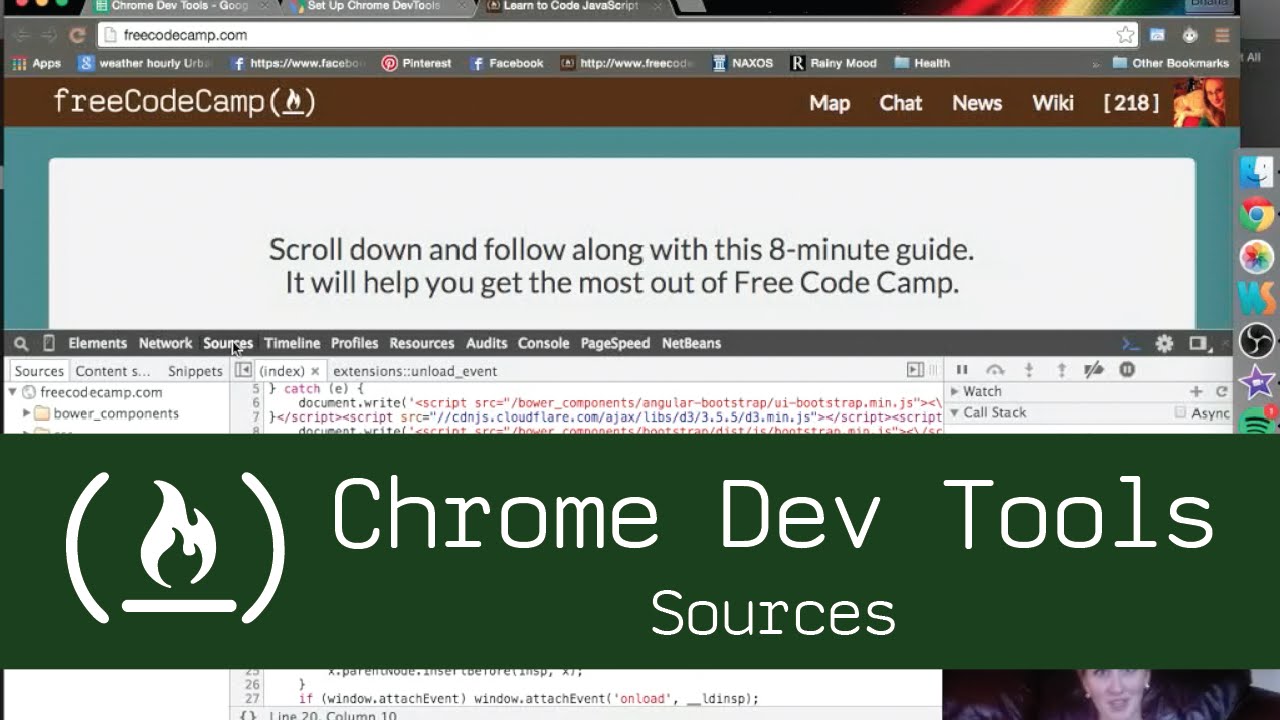
Chrome Dev Tools: Sources Tab
Показать описание
The 'Sources' tab is most useful for debugging JavaScript. The bigger your project is, the harder it can be to find exactly where a problem occurs.
You can select different parts of the code to be 'breakpoints', checkpoints that will stop the code at that exact moment.
There are different breakpoints you can watch for, like for a specific line of code, on a DOM event, a server request called XMLHTTP request, or a javascript event.
When you set a breakpoint, the browser pauses everything when it interprets that line of code or event.
By slowing everything down and giving yourself a chance to examine what's happening at every spot you've set, you can keep track of exactly what's happening in the page or app.
Once all of the breakpoints are set, you can step through the code and examine the state of your page or app at every breakpoint.
Just like with elements, you can live-edit through dev tools, but remember to save those changes however you can so your progress isn't lost.
 0:01:39
Chrome Dev Tools: Sources Tab
 0:18:21
Chrome Dev Tools Source Panel and Breakpoints
 0:10:13
Chrome DevTools Tutorials - 2 - Sources Tab | Debugging in JavaScript
 0:02:55
Chrome DevTools Tutorial 6: The Sources Tab and Basic Debugging
 0:01:02
Chrome Dev Tools: Resources Tab
 0:12:15
Debugging JavaScript in Chrome DevTools | STOP using console log
 1:14:51
Chrome DevTools - Crash Course
 0:24:58
Chrome Dev Tools Tutorials #1: Elements and Sources Tab
 0:07:28
Debugging JavaScript - Chrome DevTools 101
 0:21:02
Chrome DevTools - Everything you need to know
 0:01:44
Chrome Dev Tools: Console Tab
 0:16:44
Chrome Dev Tools Console Super Powers
 0:01:56
Chrome Dev Tools: Summary Tab
 0:30:48
Chrome DevTools Sources Tab for Debugging: How to Use It
 0:03:57
Chrome DevTools Tutorial 4: A Tour of the Developer Tools
 0:17:25
Chrome Dev Tools 101: A Beginner's Guide to Using Dev Tools
 0:03:20
Chrome Dev Tools: Memory Tab
 0:10:11
Local Overrides in Chrome Dev Tools
 0:20:55
Demystifying the Browser Networking Tab in Developer Tools With Examples
 0:09:00
Inspect Network Activity - Chrome DevTools 101
 0:00:41
Enable / Disable JavaScript in Chrome Developer Tools
 0:34:41
Google Chrome Dev Tools - Source Tab
 1:53:49
Chrome DevTools Complete Course - Learn to debug your frontend code
 0:11:37
How hackers use DevTools - Web Security #4
Комментарии