filmov
tv
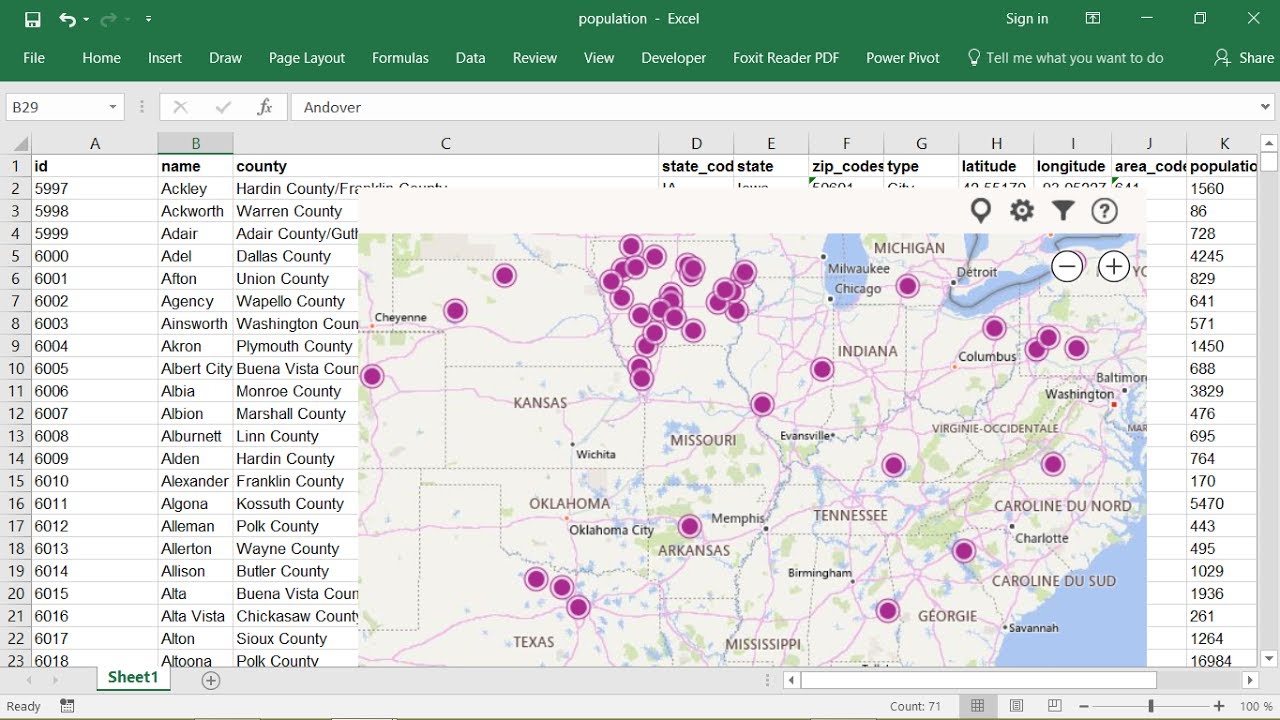
Excel 2016 visualize data on Bing maps
Показать описание
1. If you do not have the Bing Add-In installed, you can find it by clicking on the Apps for Office button.
2. Search for Bing then select and click on Trust IT.
3. If you have a Microsoft account and have signed in, you can install the app using the below steps:
You will be asked to sign-in, if you have not done so already.
In case you do not have a Microsoft account, then click on Sign In, enter you email address and click Next.
Should the email not be registered, then sign up by clicking on Sign Up in the top right corner.
4. Highlight your entire data range within your Excel worksheet.
5. If the Bing Map is already installed, click on Apps for Office and select Bing Maps under my Apps.
6. A full size map will appear. Click the X to close the prompt.
7. Click on the Show Locations button on the top of the Bing Map to display the values on the map.
8. To view an amount, click on the bubble.
 0:03:27
Excel 2016 visualize data on Bing maps
 0:07:33
Excel 2016 Visualize data in 3d maps
 0:15:06
5 Excel 2016 Tips Learn how to Visualize Data Using Charts
 0:03:49
Introduction to data visualization in Excel 2016 - 01 - Importing a CSV file
 0:14:48
Introduction to Pivot Tables, Charts, and Dashboards in Excel (Part 1)
 0:06:08
Use Excel 2016 to make Frequency distribution and Histogram for quantitative data
 0:52:27
Highline Excel 2016 Class 15: Excel Charts to Visualize Data: Comprehensive Lesson 11 Chart Examples
 0:02:30
Excel 2016 from Scratch - Visualization A
 0:09:20
Microsoft Excel 2016 - Create and Manage your Charts and Graphs [COMPLETE]
 0:03:24
Introduction to data visualization in Excel 2016 - 02 - Sorting and Improving
 0:08:09
Visualize Data Geographically in Excel with Dynamic Bubble Charts
 0:03:25
Excel 2016 from Scratch. Exercise - Visualization O
 0:07:57
Microsoft Excel Data Visualization, Excel Charts & Graphs | Excel Tutorial
 0:03:09
Excel 2016 from Scratch - Visualization C
 0:02:05
Excel 2016 from Scratch. Exercise - Visualization N
 0:04:35
Introduction to data visualization in Excel 2016 - 03 - Creating Chart and Export to PDF
 0:05:44
Excel 2016 from Scratch - Visualization D
 0:03:58
Excel 2016 from Scratch. Exercise - Visualization M
 0:03:12
Excel 2016 from Scratch - Visualization G
 0:16:01
Module 7: Visualizing Data in Excel
 0:09:30
Excel 2016 New Charting and Visualization Features
 0:02:51
Excel 2016 from Scratch. Exercise - Visualization H
 0:00:40
Data visualization charts in Excel for analyzing & creating infographs - Excel Tips and Tricks
 0:14:15
How to Create Dashboards in Excel
Комментарии