filmov
tv
Sources of Methane

Показать описание
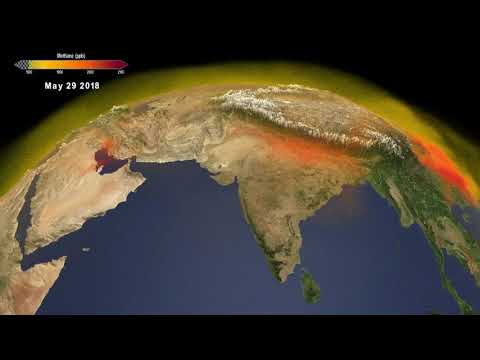
The NASA SVS visualization presented here shows the complex patterns of methane emissions produced around the globe and throughout the year from the different sources described above. The visualization was created using output from the Global Modeling and Assimilation Office, GMAO, GEOS modeling system, developed and maintained by scientists at NASA. Wetland emissions were estimated by the LPJ-wsl model, which simulates the temperature and moisture dependent methane emission processes using a variety of satellite data to determine what parts of the globe are covered by wetlands. Other methane emission sources come from inventories of human activity. The height of Earth’s atmosphere and topography have been vertically exaggerated and appear approximately 50-times higher than normal in order to show the complexity of the atmospheric flow.
Visualizers: Cindy Starr (lead), Kel Elkins, Greg Shirah, Trent L. Schindler
Music: "Motion Blur" by Sam Dobson [PRS]
 0:01:59
Sources of Methane
 0:01:39
Sources of Methane Gas emissions and its affects.
 0:03:31
What is methane? And what part does livestock farming play?
 0:02:19
NASA Models Methane Sources and Movement Around the Globe
 0:10:14
Methane’s life, death, and secret second life
 0:00:13
Sources of methane
 0:00:22
What are the sources of methane emissions?
 0:04:22
Science Action: What's the unique role of methane in climate change?
 0:01:59
Sources of Methane
 0:03:39
What is Methane?
 0:15:00
Everything you Wanted to Know About Atmospheric Methane Sources and Sinks and Forcings
 0:17:37
Identifying Sources of Methane Leaks in the Bountiful North Salt Lake Area
 0:02:39
Tackling a growing methane problem starts with the pipes | FT Energy Source
 0:08:45
The methane cycle
 0:01:02
Top 10 Methane Hotspots Revealed by Satellites!
 0:01:00
upsc cse pre 2008 Source of methane
 0:02:58
CH4 | Methane | Sources and Impacts| OIZOM Academy
 0:15:00
The Nitty-Gritty on Global Methane Sources
 0:02:01
What's the deal with methane?
 0:00:13
Third largest source of methane emissions worldwide, after oil and gas systems and agriculture
 0:02:29
Methane Rise Caused By Biological Sources
 0:29:42
Chapter 4 - Methane Sources by Oil and Gas Market Segment
 0:03:02
Uncovering the sources of methane and CO2 emissions on LNG carriers
 0:00:33
Give three sources of methane.
Комментарии