filmov
tv
Python Scipy Demo: Nonlinear Fit of AIDS data to Logistic Growth Model

Показать описание
In this video we look at a Python program that uses various modules (including scipy, matplotlib, numpy, pandas, openpyxl) to read in data from an Excel file (on the web), plot it, and fit it to a Logistic Growth Model function. The Logistic Curve has three fitting parameters for the maximum value (of the fit), the position of the halfway point (also the inflection point), and the growth rate. The curve_fit method from scipy allows us to perform a non-linear least-squares fit since the parameters are not simple coefficients. Non-linear fitting done by scipy's curve_fit method needs a starting point for the fit parameters from which to begin an iterative process. The plotting of both data and fit is done with matplotlib.
 0:13:37
Python Scipy Demo: Nonlinear Fit of AIDS data to Logistic Growth Model
 0:14:09
Python Scipy Module Demo: Using curve_fit's nonlinear least squares to fit Charging Capacitor d...
 0:14:22
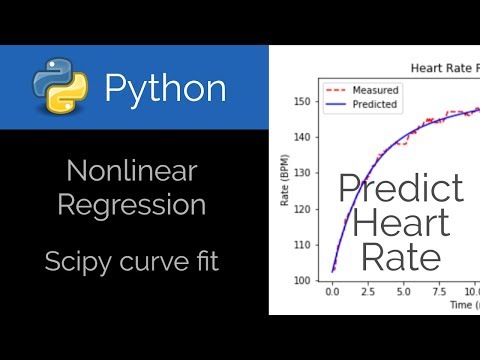
Python 🐍 Nonlinear Regression Curve Fit
 0:11:37
Non-Linear CURVE FITTING using PYTHON
 0:11:28
Python scipy curve_fit demo: Non-linear least-squares fit of chemistry peak to Lorentzian form
 0:12:24
Nonlinear regression with curvefit in python | Complete explanation
 0:06:33
How to use Python Scipy Curve Fit | Python scipy stats fit
 0:26:26
Intro to Scipy Optimization: Minimize Method
 0:13:03
Python Nonlinear Equations with Scipy fsolve
 0:18:18
Unlock the Secret of Nonlinear Curve Fitting - Python LMFIT
 0:24:50
Curve Fitting in Python (2022)
 0:00:17
Artificial neural network curve fitting / nonlinear regression
 0:46:41
scipy 4
 0:06:40
Python Nonlinear Least square|Non linear regression models| Parameter Estimation
 1:03:59
Mastering Linear Regression in Python: A Step-by-Step Tutorial | Scipy|polyfit|lmfit|scikit|Astropy
 0:11:03
SciPy Beginner's Guide for Optimization
 0:06:33
How to use SciPy to curve fit in Python || Python for Engineers
 0:24:04
Linear and Nonlinear Regression in Python
 0:04:20
Curve fitting example with Scipy leastsq() function
 0:07:56
NumPy vs SciPy
 0:04:41
Curve Fit with Scipy Optimize
 0:06:59
Curve Fitting using Numpy's Polyfit Function
 0:18:09
IMSE780 Solving Nonlionear Optimization problem with Scipy Part 1/4
 0:14:50
Python 🐍 Curve Fit with Step Test Data
Комментарии