filmov
tv
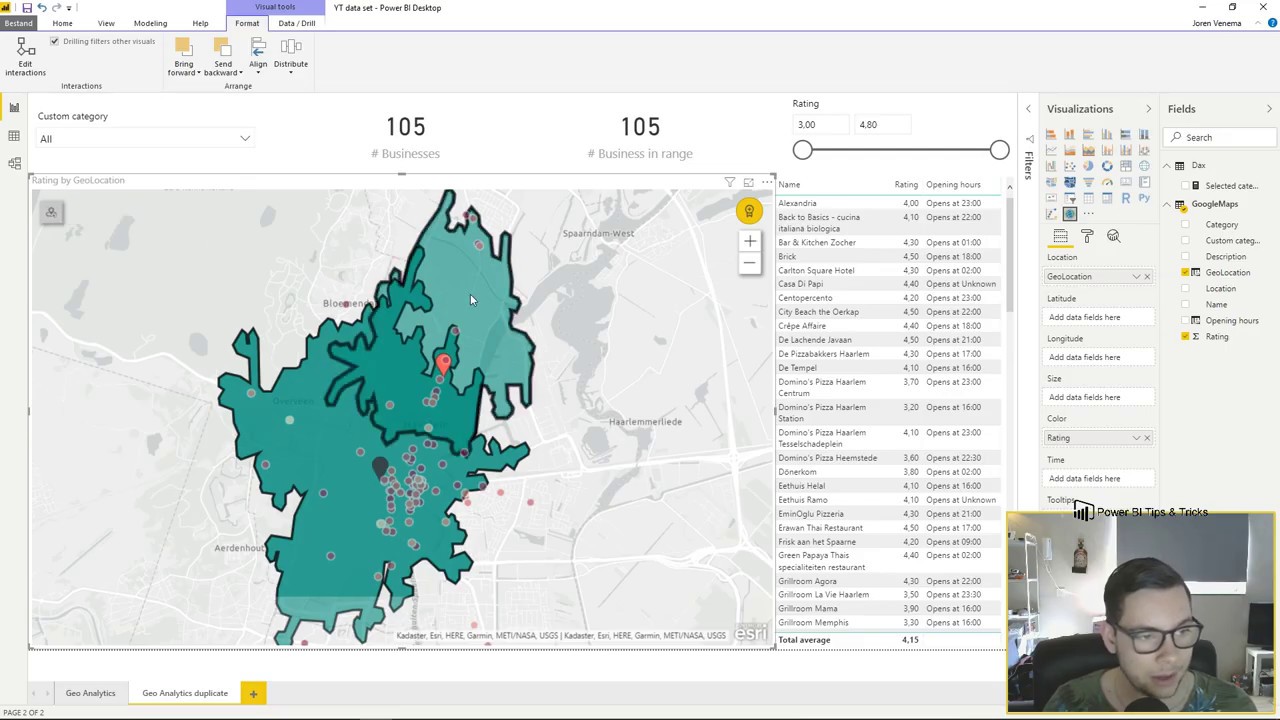
How to use buffer layers and drive time in Power BI - ArcGIS maps
Показать описание
In this video i'm gonna teach you how to utilize the drive time and radius buffer layers to calculate how many data points are within the buffer layers.
If you have any questions leave them in the comments below.
Thanks for watching.
Background music by:
Track Name: "Better Days"
License for commercial use: Creative Commons Attribution 3.0 Unported "Share Alike" (CC BY-SA 3.0) License.
If you have any questions leave them in the comments below.
Thanks for watching.
Background music by:
Track Name: "Better Days"
License for commercial use: Creative Commons Attribution 3.0 Unported "Share Alike" (CC BY-SA 3.0) License.
 0:05:58
How to use buffer layers and drive time in Power BI - ArcGIS maps
 0:03:22
How to do buffer analysis in ArcGIS
 0:16:11
How to Use the Buffer Tool in ArcGIS Pro
 0:15:14
Tableau BUFFER functions - a complete TUTORIAL on using buffers for spatial analysis
 0:02:56
How to create a buffer layer in QGIS
 0:04:14
Buffer Analysis Using ArcGIS Pro
 0:01:59
How To Create a Buffer in ArcGIS Pro
 0:12:22
QGIS Tutorials 33: How to create fixed buffer in QGIS | Beginners | QGIS 3.22
 0:18:20
Spatial Parameters in Tableau 2024.3
 0:03:13
Buffer ArcGIS - ArcGIS Buffer Analysis - Arcmap Tutorial For Beginners
 0:02:13
How to Create Point Buffer in QGIS
 0:02:40
How to buffer things in QGIS
 0:10:11
Mastering V-Ray Frame buffer | Layers | History | Lightmix |
 0:03:23
Create Roads with Buffer ArcMap
 0:01:23
V Ray 6 Frame Buffer
 0:07:47
How to Use Negative Distances in Buffer Analysis
 0:00:43
HOW TO USE CURVE CORRECTION VRAY FRAME BUFFER OF 3DS MAX
 0:11:53
[PYTHON IN ARC GIS #1] USE BUFFER ANALYSIS USING PYTHON IN ARC GIS FOR BEGINNERS
 0:08:13
Beginners guide to wet sand and buff your paint like glass!
 0:01:59
How to use the Buffer tool in GOAT
 0:26:40
Buffer and Multiple Ring Buffer to Point/Line/Polygon Features in ArcGIS Software
 0:04:51
Render Settings and Frame Buffer Color Correction - Vray For Sketchup
 0:14:55
How to do Buffer Analysis in GIS | Buffer in GIS
 0:05:10
How to buffer features in QGIS
Комментарии