filmov
tv
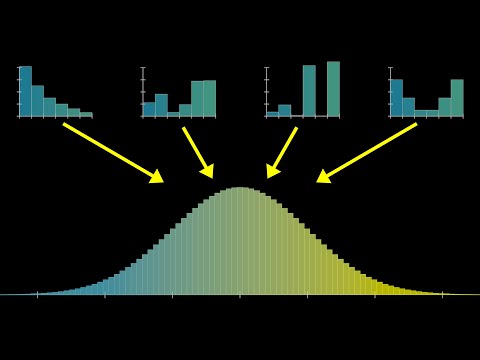
Visualizing the Normal Distribution with Mathematica

Показать описание
We're often just given tables of Normal Curve probabilities. Mathematica can help us connect the geometry behind what these probabilities are. Let me show you this really cool visualization.
I’m Dr. John Estes, the Yerger Chair of Mathematics, Director of Engineering Partnerships, and Associate Professor of Mathematics at Belhaven University. I have been teaching mathematics professionally since 2008, and I love helping students understand the wonderful world of mathematics more.
-------------------------------------------------------------------------------------------------------
Come study with me at Belhaven University!
 0:06:02
 0:01:00
 0:00:20
 0:05:26
 0:09:08
 0:00:30
 0:05:13
 0:01:04
 0:32:45
 0:01:42
 0:06:57
 0:00:15
 0:03:37
 0:01:00
 0:00:07
 0:07:08
 0:31:15
 0:07:22
 0:03:36
 0:06:55
 0:01:36
 0:00:14
 0:00:13
 0:00:12