filmov
tv
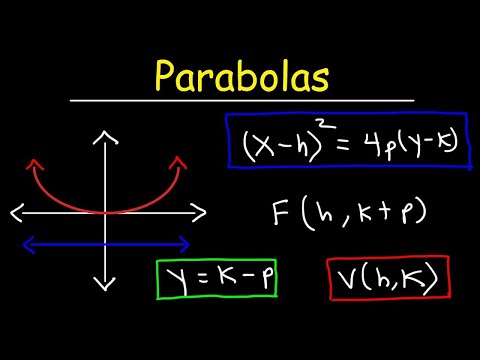
Figure shows a parabolic graph between Tand 1/V

Показать описание
Figure shows a parabolic graph between T and 1V (T= temperature, V= volume) for a mixture of gases undergoing an adiabatic process. The ratio of rms velocity of molecules and speed of sound in the mixture of gases at the same temperature is given by √n. Find n.
 0:03:12
 0:02:02
 0:02:45
 0:02:02
 0:02:45
 0:00:47
 0:34:54
 0:00:31
 0:06:57
 0:00:30
 0:09:39
 0:10:43
 0:03:26
 0:08:05
 0:00:25
 0:00:16
 0:01:00
 0:00:15
 0:10:55
 0:15:29
 0:00:24
 0:28:53
 0:00:35
 0:01:00