filmov
tv
Interactive knowledge graph visualization with SVG and JavaScript

Показать описание
This widget allows you to explore the sitemap of your website. The sitemap is considered as a network of pages connected by links. There is always one page selected in the center of the widget, and all connected pages are rendered in a circle around it. The widget was displayed by the company Le-Tex on the international book fair in Frankfurt, Germany.
 0:01:03
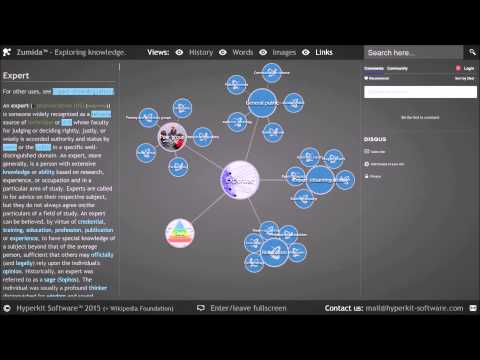
Interactive knowledge graph visualization with HTML Canvas and JavaScript build on the Wikipedia API
 0:00:42
Interactive knowledge graph visualization with HTML Canvas and JavaScript integrated with Wikipedia
 0:02:00
Advanced interactive knowledge graph visualization with HTML Canvas and JavaScript
 0:00:59
Interactive knowledge graph visualization with SVG and JavaScript
 0:00:44
Interactive knowledge graph visualization with HTML Canvas and JavaScript integrated with Wikipedia
 0:12:06
Cheuk Ho - Interactive Knowledge Graph Visualization in Jupyter Notebook | JupyterCon 2020
 0:49:41
Enterprise knowledge graph visualization principles that work
 0:00:58
How To Visualise Your Knowledge Graph | Data Graphs
 0:14:26
Most Popular Knowledge Graph Visualization Types w/Examples
 0:02:37
Neo4j in 100 Seconds
 0:00:38
Knowledge graph visualization with HTML Canvas and JavaScript build on Wikipedia API
 0:01:33
3ZENTREE INTRODUCTION (EARLY DEMO) - 3d knowledge graph
 0:00:36
Knowledge Graph Demo Oct. 17 2022
 0:04:30
Create an Interactive 3D Graph with ChatGPT
 0:01:21
Graph Visualization in Open Research Knowledge Graph
 0:00:41
Visualising your knowledge graph in Data Graphs
 0:00:36
Building a knowledge graph with AI for acupuncture and TCM #infranodus #gpt #chatgpt #acupuncture
 0:05:15
Using knowledge graph software to visualize a network of dependencies
 0:12:41
Creating an Interactive Knowledge Graph: Challenges and Solutions
 0:06:06
Visualize Interactive Network Graphs in Python with pyvis
 0:01:01
Interactive graph visualisation
 0:03:38
Gruff - Graph Visualization and Exploration embedded in a webpage or your application
 0:16:08
Knowledge Graphs - 0.0 Lecture Overview
 0:27:39
Uncover insights in your complex data with graph visualization
Комментарии