filmov
tv
Show Top Ten Results - Excel PivotTable Tricks
Показать описание
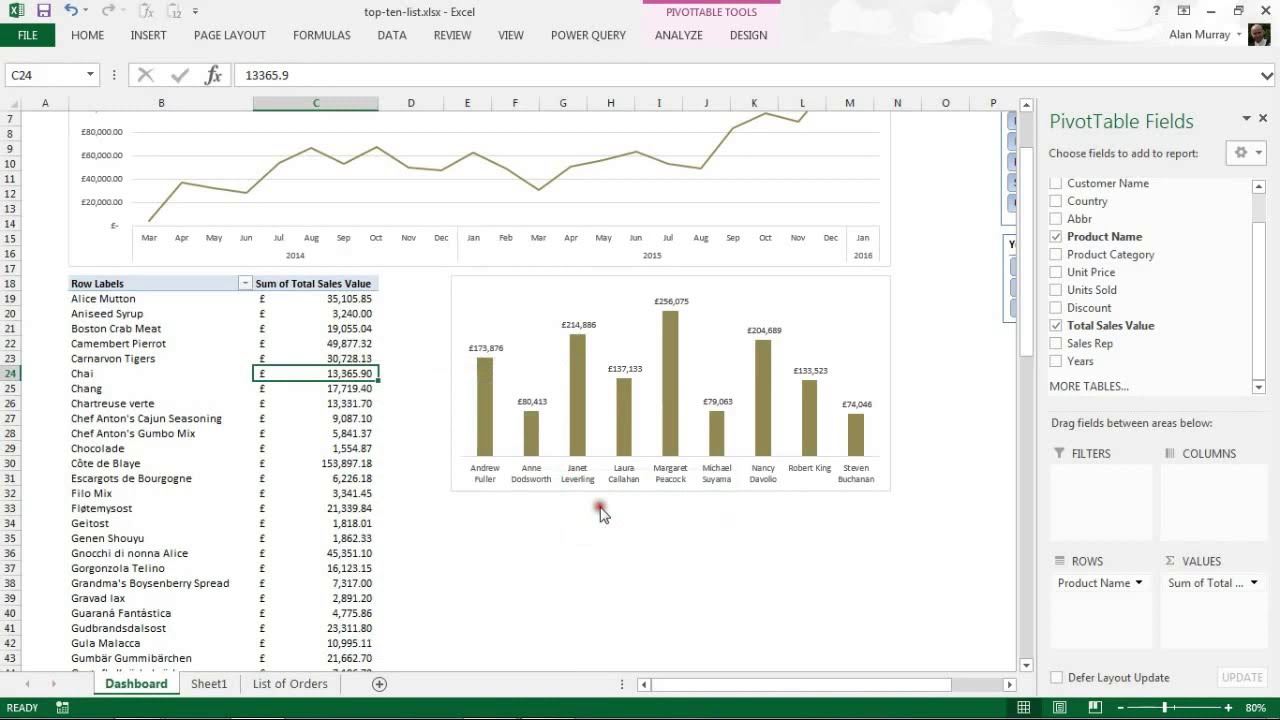
Filter your Excel PivotTable to display only the top ten results. This technique can be really awesome in Excel dashboards when space is limited.
This video tutorial shows how to filter for the top ten results in an Excel PivotTable dashboard. The dashboard is set up with Slicers for interactivity. The top ten selling products created in the lesson complete the dashboard.
The video also shows how to stop columns from autofitting when data is filtered. This is a really useful skill when creating interactive dashboards.
You can also get your PivotTable to display the top 5, or top 15 results. It can also be used to display percentages such as top 10% or bottom 10%.
Here are the timings for the video.
00:00 - Introduction
01:55 - Create the PivotTable
03:42 - Show top ten in Excel PivotTable
05:26 - Connect the Slicers to the top ten PivotTable
06:17 - Stop PivotTable columns widths changing
Find more great free tutorials at;
*** Online Excel Courses ***
Connect with us!
 0:08:08
Show Top Ten Results - Excel PivotTable Tricks
 0:01:24
How to show only the top 10 results in excel pivot tables
 0:06:44
Create an Interactive Top N Report in Excel (includes duplicate values) with Filter Function
 0:04:43
Excel 2013: Pivot Charts to show top 10 or top 20 results
 0:04:56
Top 10 Values with One Excel Formula
 0:04:20
Top ten results in calculus
 0:08:22
Excel Tips for Teachers Episode 3: Ranking results in Excel
 0:27:49
Space Station Research: Top Ten Results (Part 1)
 0:17:20
American Idol TOP 10 Fan Poll Results: Who Will Make It Into The Top 10?
 0:18:18
Top 10 Catamarans 2023: THE FINAL RESULTS!
 0:12:35
Best Marketing Campaigns of the Last Decade: 2010 - 2020 - Digital Uncovered
 0:28:22
Space Station Research: Top Ten Results (Part 2)
 0:00:27
What to Do if You Didn’t Study
 0:00:16
X Factor Live Results Show 4 - Top 10 Hits - #StyleFactor
 0:04:36
‘American Idol’ Fans Stunned by Top 10 Results
 0:06:28
American Idol 2012 Top 10 Results show Recap The Big Topic
 0:05:57
BEST TOP 200 SCHOOLS IN 2023 KCSE RESULTS|KCSE RESULTS SUMMARY|EXCELLENT 200 SCHOOLS PERFORMANCE
 0:05:14
Excel Rank Function with different ranks for same values
 0:00:34
🏆 EUROVISION 2024 OFFICIAL RESULTS: TOP 5 (AFTER THE SHOW)
 0:00:37
How To Grow Taller ☝🏼 #shorts
 0:04:55
AGT 2021 Grand Final Top 10 Results
 0:01:45
After The Show: The Top 10 Results - AMERICAN IDOL SEASON XIII
 0:01:09
American Made makes history: Raw highlights, Sept. 16, 2024
 0:19:12
JUDGE THU GENNA | TOP 10 Results Show
Комментарии