filmov
tv
Statistics Using Python Tutorial Part 9 | Probability Mass Function | Data Science Tutorial #9
Показать описание
Statistics Using Python Tutorial Part 9 | Probability Mass Function | Data Science Tutorial #9
Hello and welcome back to another session of statistics tutorial using Python Powered by Acadgild. In the previous video, you have learned the Central Limit Theorem and sample distribution in statistics.
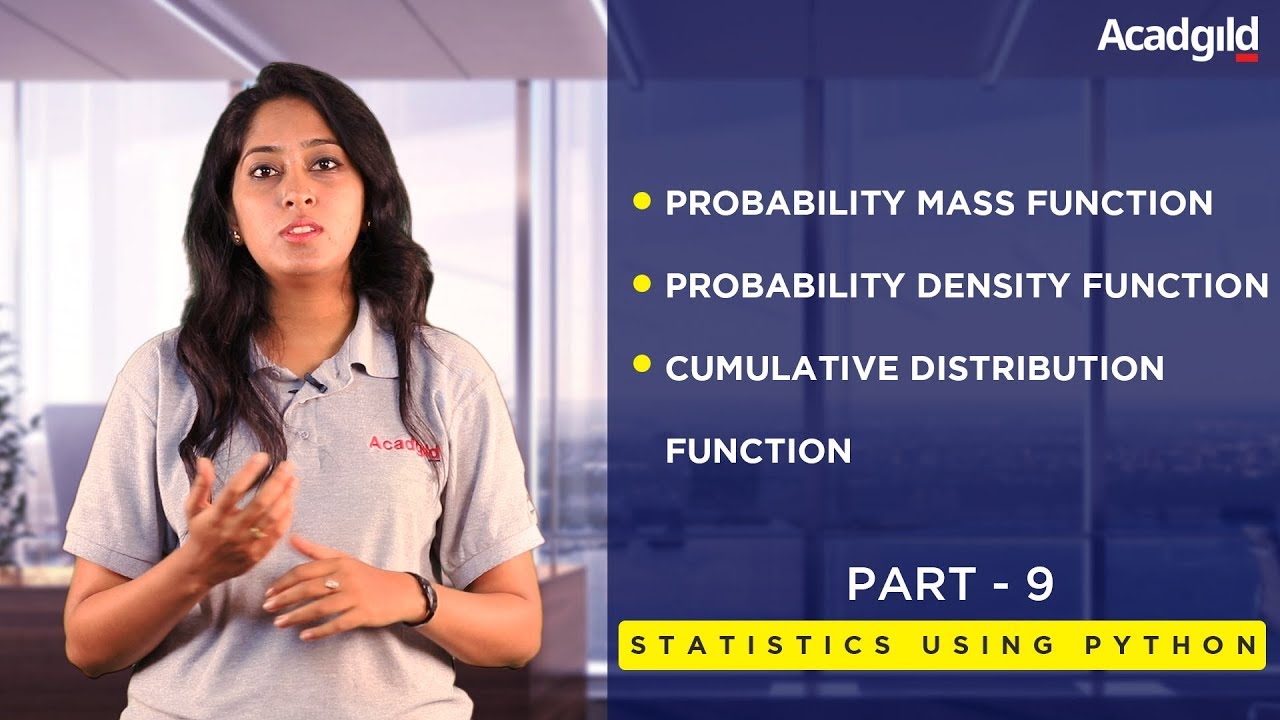
In this video, you will be able to learn, probability mass function, Probability density function, Cumulative distribution function. Before that, if you have missed the previous, please check the links as follows.
What is the probability mass function?
A probability mass function gives us the frequency function which gives us the probability for a discrete random variable. When it is said random variables from an experiment like rolling a dice, choosing the number of hats, or getting a high score in a test. The discrete part of this means, that there is a set of numbers of outcomes.
What is the probability density function?
This nothing but a statistical expression, that defines the probability distribution for continuous random variable supposed to a discrete random variable.
What is the cumulative distribution function?
The cumulative distribution function of a random variable is another method to describe the distribution of random variables. The advantage of the cumulative distribution function is that it can be defined for any kind of random variable that is discrete, continuous or even mixed.
Cumulative distribution function gives you a cumulative probability associated with the function. It is a similar concept to a cumulative frequency table.
Kindly, go through the complete video and know the examples associated with the above topics. Please like, share and subscribe to the channel for more tutorials.
#Probability #mass, #function #Statistics, #datascience
For more updates on courses and tips follow us on:
Hello and welcome back to another session of statistics tutorial using Python Powered by Acadgild. In the previous video, you have learned the Central Limit Theorem and sample distribution in statistics.
In this video, you will be able to learn, probability mass function, Probability density function, Cumulative distribution function. Before that, if you have missed the previous, please check the links as follows.
What is the probability mass function?
A probability mass function gives us the frequency function which gives us the probability for a discrete random variable. When it is said random variables from an experiment like rolling a dice, choosing the number of hats, or getting a high score in a test. The discrete part of this means, that there is a set of numbers of outcomes.
What is the probability density function?
This nothing but a statistical expression, that defines the probability distribution for continuous random variable supposed to a discrete random variable.
What is the cumulative distribution function?
The cumulative distribution function of a random variable is another method to describe the distribution of random variables. The advantage of the cumulative distribution function is that it can be defined for any kind of random variable that is discrete, continuous or even mixed.
Cumulative distribution function gives you a cumulative probability associated with the function. It is a similar concept to a cumulative frequency table.
Kindly, go through the complete video and know the examples associated with the above topics. Please like, share and subscribe to the channel for more tutorials.
#Probability #mass, #function #Statistics, #datascience
For more updates on courses and tips follow us on:
 0:07:24
Statistics Using Python Tutorial Part 1 | Statistics with Python Tutorial | Data Science Tutorial #1
 0:23:01
Python Pandas Tutorial (Part 1): Getting Started with Data Analysis - Installation and Loading Data
 4:22:13
Data Analysis with Python - Full Course for Beginners (Numpy, Pandas, Matplotlib, Seaborn)
 1:11:27
Statistical Data Analysis in Python, SciPy2013 Tutorial, Part 1 of 4
 0:00:57
Do FASTER Python Exploratory Data Analysis with this!
 0:01:00
SooOOooo...just how FAST is this PYTHON library for Data Science?
 0:01:00
Plotting Data in Python using Pandas #datascience #shorts
 0:26:31
Statistics Using Python | Statistics Python Tutorial | Python Certification Training | Edureka
 10:17:55
Python course tutorials live streaming 10 hours part 304
 1:00:06
Python for Beginners - Learn Coding with Python in 1 Hour
 0:01:00
Linear Regression with Python in 60 Seconds #shorts
 0:11:36
Classes and Objects with Python - Part 1 (Python Tutorial #9)
 0:20:42
YouTube Data API Tutorial with Python - Analyze Channel Statistics - Part 1
 0:35:41
Python Pandas Tutorial (Part 10): Working with Dates and Time Series Data
 0:27:57
Getting Started With Dash: Easy Data Visualization In Python - Part 1/3
 1:09:15
Data Analysis with Python: Part 1 of 6 (Live Course)
 0:33:35
Python Pandas Tutorial (Part 2): DataFrame and Series Basics - Selecting Rows and Columns
 1:54:40
Bayesian Statistical Analysis using Python - Part 1 | SciPy 2014 | Chris Fonnesbeck
 0:15:40
Python Pandas Tutorial (Part 7): Sorting Data
 1:03:21
👩💻 Python for Beginners Tutorial
 8:15:04
Statistics - A Full University Course on Data Science Basics
 0:49:06
Python Pandas Tutorial (Part 8): Grouping and Aggregating - Analyzing and Exploring Your Data
 0:24:38
Python Tutorial for Absolute Beginners #1 - What Are Variables?
 9:56:23
Data Analysis with Python Course - Numpy, Pandas, Data Visualization
Комментарии