filmov
tv
Statistical Data Analysis in Python, SciPy2013 Tutorial, Part 1 of 4
Показать описание
Presenter: Christopher Fonnesbeck
Description
This tutorial will introduce the use of Python for statistical data analysis, using data stored as Pandas DataFrame objects. Much of the work involved in analyzing data resides in importing, cleaning and transforming data in preparation for analysis. Therefore, the first half of the course is comprised of a 2-part overview of basic and intermediate Pandas usage that will show how to effectively manipulate datasets in memory. This includes tasks like indexing, alignment, join/merge methods, date/time types, and handling of missing data. Next, we will cover plotting and visualization using Pandas and Matplotlib, focusing on creating effective visual representations of your data, while avoiding common pitfalls. Finally, participants will be introduced to methods for statistical data modeling using some of the advanced functions in Numpy, Scipy and Pandas. This will include fitting your data to probability distributions, estimating relationships among variables using linear and non-linear models, and a brief introduction to Bayesian methods. Each section of the tutorial will involve hands-on manipulation and analysis of sample datasets, to be provided to attendees in advance.
The target audience for the tutorial includes all new Python users, though we recommend that users also attend the NumPy and IPython session in the introductory track.
Outline
Introduction to Pandas (45 min)
Importing data
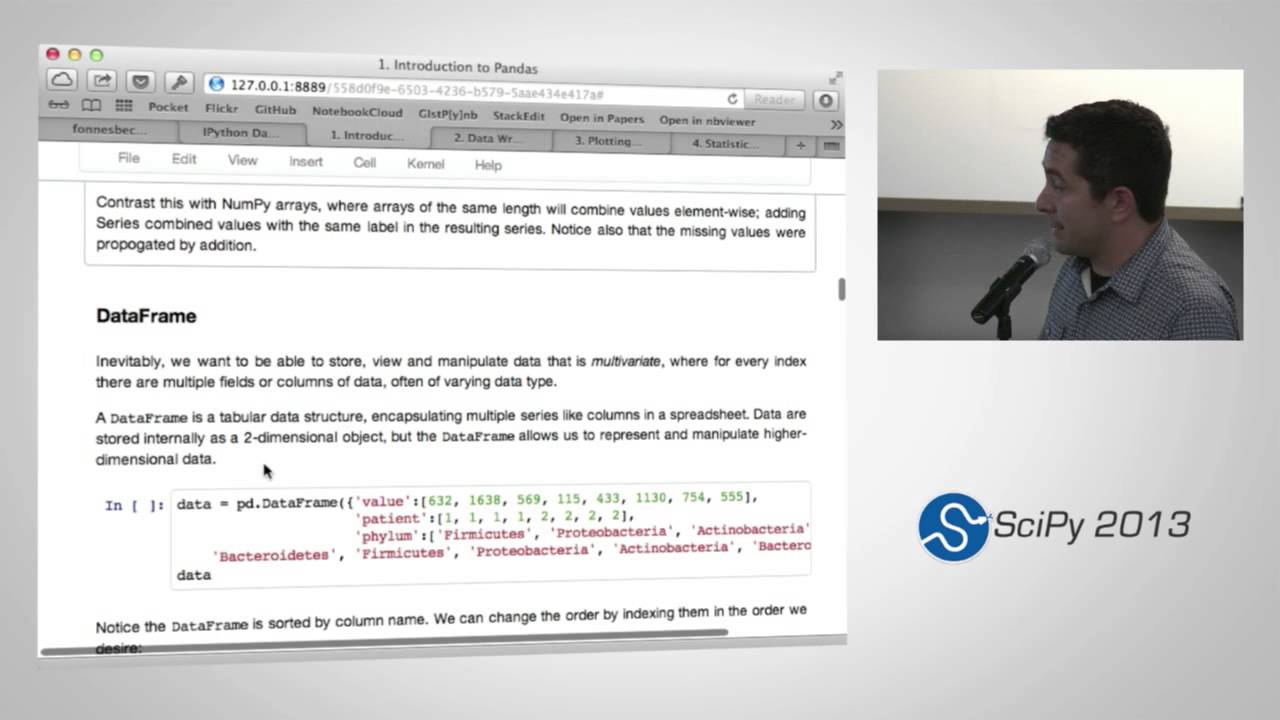
Series and DataFrame objects
Indexing, data selection and subsetting
Hierarchical indexing
Reading and writing files
Date/time types
String conversion
Missing data
Data summarization
Data Wrangling with Pandas (45 min)
Indexing, selection and subsetting
Reshaping DataFrame objects
Pivoting
Alignment
Data aggregation and GroupBy operations
Merging and joining DataFrame objects
Plotting and Visualization (45 min)
Time series plots
Grouped plots
Scatterplots
Histograms
Visualization pro tips
Statistical Data Modeling (45 min)
Fitting data to probability distributions
Linear models
Spline models
Time series analysis
Bayesian models
Required Packages
Python 2.7 or higher (including Python 3)
pandas 0.11.1 or higher, and its dependencies
NumPy 1.6.1 or higher
matplotlib 1.0.0 or higher
pytz
IPython 0.12 or higher
pyzmq
tornado
Description
This tutorial will introduce the use of Python for statistical data analysis, using data stored as Pandas DataFrame objects. Much of the work involved in analyzing data resides in importing, cleaning and transforming data in preparation for analysis. Therefore, the first half of the course is comprised of a 2-part overview of basic and intermediate Pandas usage that will show how to effectively manipulate datasets in memory. This includes tasks like indexing, alignment, join/merge methods, date/time types, and handling of missing data. Next, we will cover plotting and visualization using Pandas and Matplotlib, focusing on creating effective visual representations of your data, while avoiding common pitfalls. Finally, participants will be introduced to methods for statistical data modeling using some of the advanced functions in Numpy, Scipy and Pandas. This will include fitting your data to probability distributions, estimating relationships among variables using linear and non-linear models, and a brief introduction to Bayesian methods. Each section of the tutorial will involve hands-on manipulation and analysis of sample datasets, to be provided to attendees in advance.
The target audience for the tutorial includes all new Python users, though we recommend that users also attend the NumPy and IPython session in the introductory track.
Outline
Introduction to Pandas (45 min)
Importing data
Series and DataFrame objects
Indexing, data selection and subsetting
Hierarchical indexing
Reading and writing files
Date/time types
String conversion
Missing data
Data summarization
Data Wrangling with Pandas (45 min)
Indexing, selection and subsetting
Reshaping DataFrame objects
Pivoting
Alignment
Data aggregation and GroupBy operations
Merging and joining DataFrame objects
Plotting and Visualization (45 min)
Time series plots
Grouped plots
Scatterplots
Histograms
Visualization pro tips
Statistical Data Modeling (45 min)
Fitting data to probability distributions
Linear models
Spline models
Time series analysis
Bayesian models
Required Packages
Python 2.7 or higher (including Python 3)
pandas 0.11.1 or higher, and its dependencies
NumPy 1.6.1 or higher
matplotlib 1.0.0 or higher
pytz
IPython 0.12 or higher
pyzmq
tornado
 0:16:30
Python for Data Analysis: Descriptive Statistics
 0:13:56
How I use Python as a Data Analyst
 4:22:13
Data Analysis with Python - Full Course for Beginners (Numpy, Pandas, Matplotlib, Seaborn)
 0:25:35
Statistics Fundamentals in Python
 0:11:35
How I'd Learn PYTHON For DATA ANALYSIS | If I Had To Start Over Again
 0:11:51
R vs Python | Which is Better for Data Analysis?
 0:40:22
Exploratory Data Analysis with Pandas Python
 11:09:41
Python for Data Analytics - Full Course for Beginners
 6:41:00
Day 7 — Python for Data Analysis (Part 2)
 0:00:43
How I explore data with PYTHON as a DATA ANALYST
 0:00:26
I can't STOP reading these Machine Learning Books!
 0:08:16
I started my data analyst career taking these beginner courses
 3:57:46
Data Analysis with Python for Excel Users - Full Course
 1:11:27
Statistical Data Analysis in Python, SciPy2013 Tutorial, Part 1 of 4
 0:32:13
Exploratory Data Analysis in Pandas | Python Pandas Tutorials
 1:27:34
Practical Statistics for Data Scientists - Chapter 1 - Exploratory Data Analysis
 0:04:08
Data Analytics - The 9 Essential Tools! (2024)
 0:00:57
Do FASTER Python Exploratory Data Analysis with this!
 0:00:48
How I'd Learn to Become a Data Analyst
 0:20:07
Python for Data Analysis: Hypothesis Testing and T-Tests
 0:00:46
How I use Statistics as a Data Analyst
 0:10:59
How I Would Learn Data Analysis (If I Could Start Over in 2024)
 0:07:20
Python: Descriptive Statistical Analysis: English
 0:28:52
Exploratory Data Analysis in Python using pandas
Комментарии