filmov
tv
Graphing the Tangent Function with a Change in Period

Показать описание
👉 Learn how to graph a tangent function. To graph a tangent function, we first determine the period (the distance/time for a complete oscillation), the phase shift (the horizontal shift from the parent function), the vertical shift (the vertical shift from the parent function) and the asymptotes (the two vertical lines which the graph does not touch). After we have obtained these features, we plot the points on the graph and graph accordingly.
Organized Videos:
✅ How to Graph Trigonometric Functions
✅ How to Graph Tangent | Learn About
✅ How to Graph Secant | Learn About
✅ How to Graph Sine and Cosine | Learn About
✅ How to Graph Trigonometric Functions | Learn About
✅ How to Graph The Sine Function
✅ How to Graph The Cosine Function
✅ How to Graph The Tangent Function
✅ How to Graph The Cotangent Function
✅ How to Graph Cosecant Function
✅ How to Graph The Secant Function
Connect with me:
#trig #graphing #brianmclogan
 0:05:10
Graph the Tangent Equation with a Reflection and Phase Shift
 0:08:44
Graphing the Tangent Function with a New Period
 0:02:33
How to Graph Tangent (Simplified)
 0:01:39
Visualizing Trigonometry: Tangent Function
 1:07:58
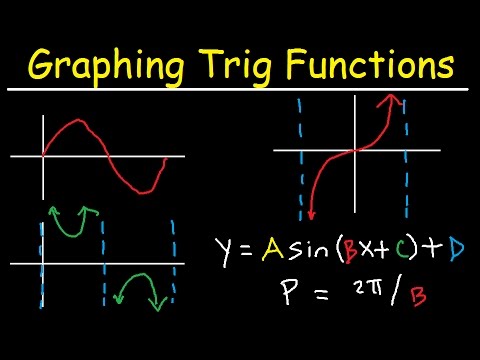
Graphing Trigonometric Functions, Phase Shift, Period, Transformations, Tangent, Cosecant, Cosine
 0:06:13
How to graph the tangent function
 0:06:56
Graph a Tangent Transformation in the Form: y=atan(bx+c)+d
 0:10:12
Tangent graph | Graphs of trig functions | Trigonometry | Khan Academy
 0:00:43
TANGENT, 'The Tangent equation, Tangent Line'.
 0:05:32
Graph the Tangent Function with a Phase Shift
 0:04:56
Graphing the Tangent Function with a Change in Period
 0:07:18
Graphing the Tangent Functions with a Phase Shift
 0:39:35
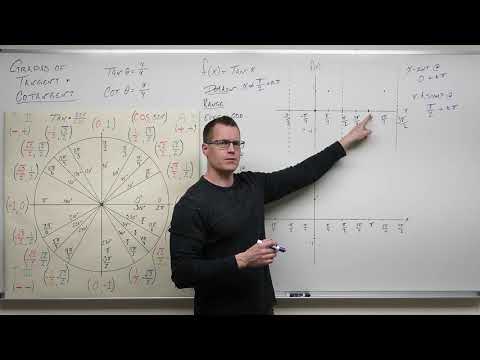
Mastering Graphing of Tangent & Cotangent Functions - [2-21-15]
 0:12:25
Trigonometry - The graphs of tan and cot
 0:04:27
How to Graph Tan (Tangent) - More Challenging
 0:05:45
How Do You Graph the Tangent Function Multiplied by a Number
 0:08:15
Graphing the Tangent Function
 0:26:14
How to Graph Tangent and Cotangent (Precalculus - Trigonometry 13)
 0:03:45
Learn How to Graph the Tangent Function by Changing the Period
 0:33:09
Graphing Tangent Functions (practice problems)
 0:07:20
Ex: Graph a Transformation of the Tangent Function (Period and Horizontal Shift)
 0:06:57
Graphing a Tangent Transformation
 0:02:52
Graphing a Tangent Function - EX 2
 0:03:03
Graphing a Tangent Function - EX 1
Комментарии