filmov
tv
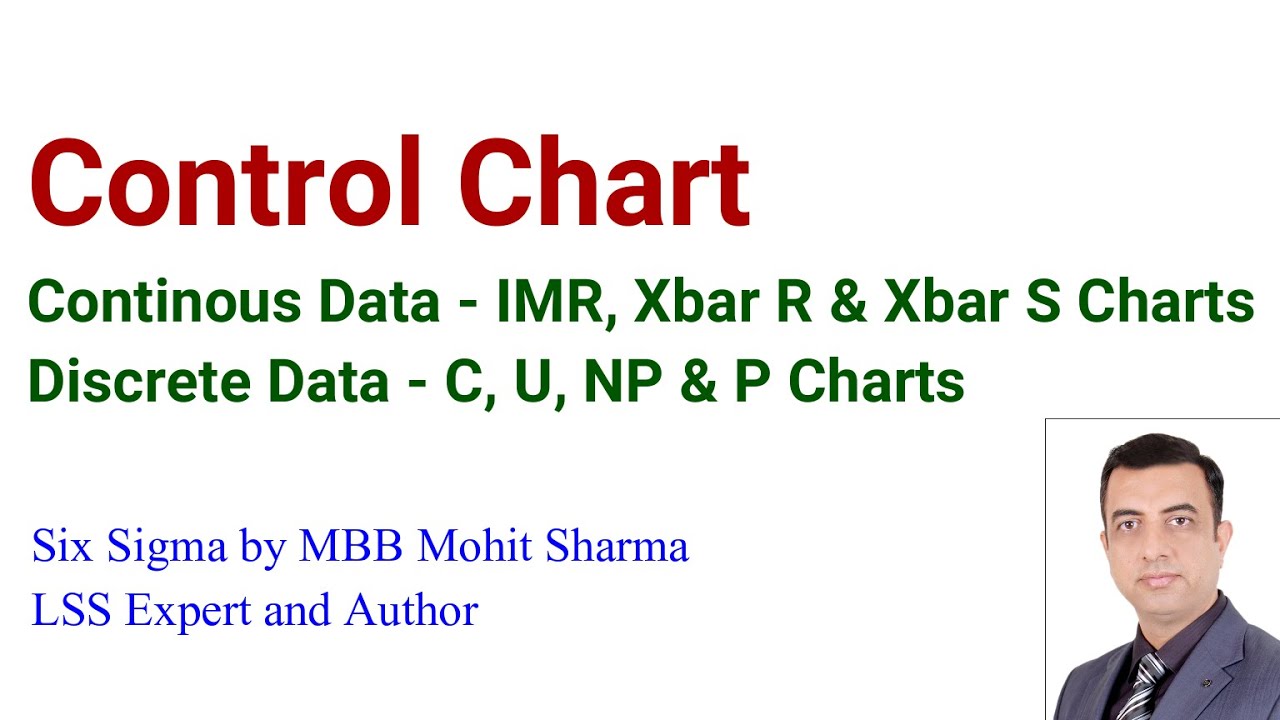
Complete Control Chart Minitab Tutorial in less than 10 mins
Показать описание
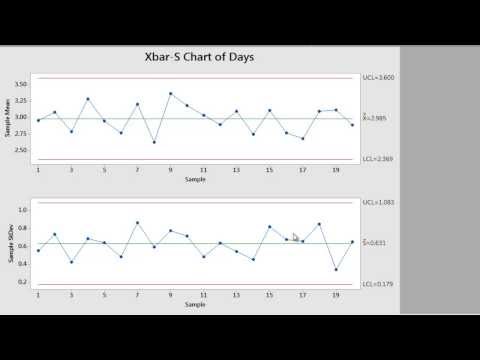
Learn 7 different type of control charts in Minitab. Easily learn IMR, X bar R , X bar S, C, u, p and np in less than 10 minutes.
If you find this video useful, don't forget to subscribe to my channel and show your interest by hitting the like button. Share it with you friends who can benefit from this.
Thanks for all your support.
Do drop in your comments and connect with me on other social media too.
Read My Book 8 Steps to Problem Solving for easy and concise explanation of LSS topics with the help of case studies.
Disclaimer... All this content is copyrighted. Please do not use any content without my permission.
You can checkout my First Six Sigma book, 8 Steps to Problem Solving. It is available at all leading stores online. Links are mentioned below for your ease.
Flipkart
Amazon
Shopclues
Smashwords
Filmora Wondershare Video Editor is used for editing.
 0:09:32
Complete Control Chart Minitab Tutorial in less than 10 mins
 0:05:08
How to Create Control Charts using Minitab 17
 0:06:32
Minitab Control Charts with Multiple Stages
 0:39:31
Minitab18 Control Charts
 0:04:25
How to Create Control Charts in Minitab Statistical Software
 0:01:27
How to create an X-bar control chart | Minitab Tutorial Series
 0:09:32
X Bar R Chart - Minitab Tutorial
 0:08:03
Learn all the variations of X bar R control chart with Minitab working
 0:12:03
Run Chart Vs Control Chart using Minitab |Step by step demonstration | Lean Six Sigma lesson # 39
 0:59:15
Minitab Statistical Software: Control Chart
 0:48:43
Minitab Statistical Software: Control Charts
 0:01:24
How to use a control chart with stages and Minitab’s Assistant | Minitab Tutorial Series
 0:07:08
How to plot Xbar and R Charts using Minitab
 0:03:44
Control Chart Minitab
 0:12:13
How to Create Control Chart In Minitab | Instantly Know Quality Process by Control Chart
 1:01:41
Minitab Statistical Software: Control Charts
 0:54:12
Minitab 20: Control Charts Webinar
 0:09:49
Control Chart : How to draw control chart with stages in #minitab
 0:38:24
Control Charts with Minitab
 0:08:09
Learn how to create Control Chart with Continuous data and their Minitab working
 0:33:04
CONTROL CHART FULL COURSE WITH EXAMPLES x bar, r , p , np chart, u chart , c chart, i with MINITAB
 0:04:16
How to run Control Chart Using Minitab
 0:12:16
CONTROL CHART BASICS and the X-BAR AND R CHART +++++ EXAMPLE
 0:16:13
control chart with minitab
Комментарии