filmov
tv
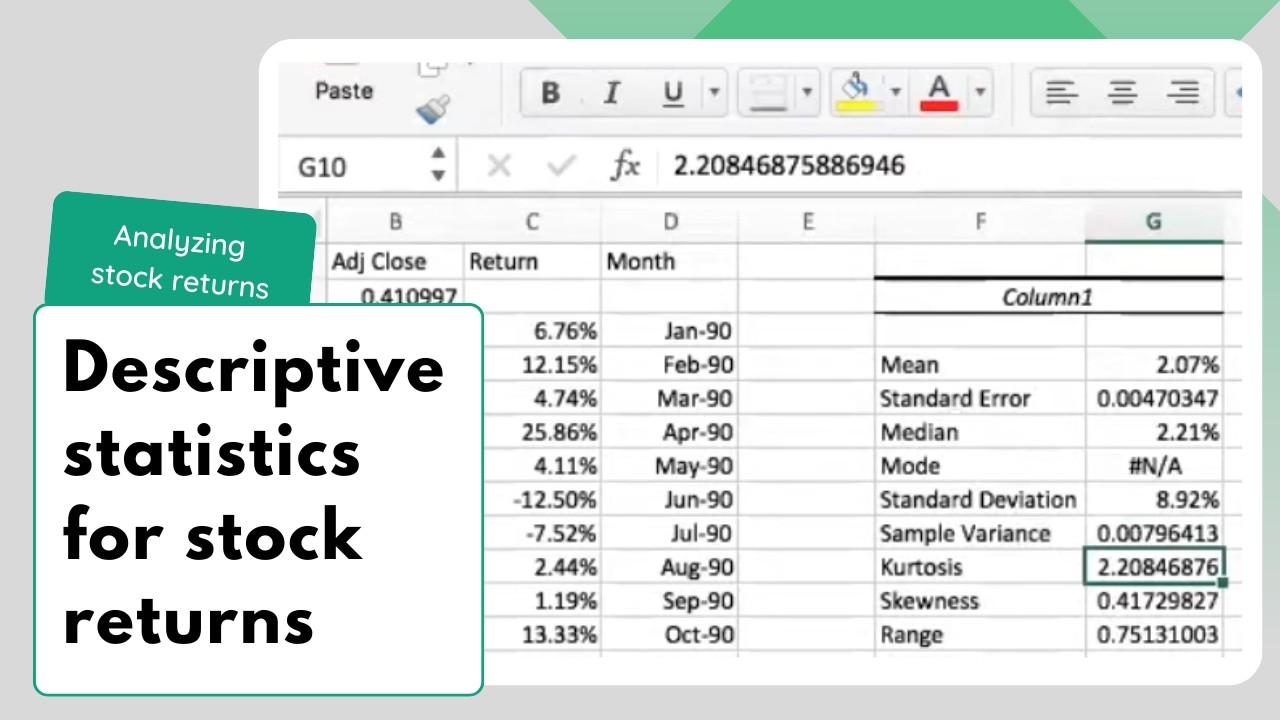
Descriptive statistics for stock returns / Analyzing stock returns / Episode 4
Показать описание
We explain how to use Excel's data analysis tool to obtain descriptive statistics for a stock's return distribution. We also discuss how to interpret these descriptive statistics.
0:00 Excel's "descriptive statistics" tool
1:32 Interpreting "mean" and "median";
2:45 "standard deviation", "minimum", and "maximum";
3.32 "kurtosis" and "skewness".
5.24 Comparing descriptive statistics across two stocks
See also our detailed post on this topic:
Enjoying our content?
Become a member for exclusive videos & posts and early access to upcoming content:
Click the link below to subscribe to our channel:
You can also follow us on X (Twitter):
And, here are our official Facebook, Instagram, and Pinterest pages:
And, visit our website for free courses, tutorials, and more:
#stocks #analysis #tutorial
 0:10:19
Descriptive statistics for stock returns / Analyzing stock returns / Episode 4
 0:08:51
Descriptive Statistics - Part 1
 0:01:00
Descriptive Statistics in Excel Mean, Median, Mode, Std. Deviation,...
 0:06:28
Creating a histogram of stock returns / Analyzing stock returns / Episode 3
 0:05:36
Descriptive Statistics in Excel Using the Data Analysis Tool
 0:04:39
Descriptive Statistics on Returns in Excel
 0:19:26
Session 3: Descriptive Statistics
 0:14:59
Statistics in Excel Tutorial 1.1. Descriptive Statistics using Microsoft Excel
 0:50:34
STAT 4051 Final Exam Preview Video link
 0:10:33
Descriptive Statistics Stock Analysis in Excel in 10 mins
 0:21:04
Session 3A: Descriptive Statistics - Applications in Finance & Investing
 0:03:14
Compute Summary Statistics of Stock Returns
 0:00:55
Data Analysis Excel Descriptive Statistics Tutorial
 0:25:45
Descriptive Statistics for share price using Spreadsheet
 0:31:22
Statistical Concepts and Market Returns (2021 Level I CFA® Exam – Reading 7)
 0:06:10
What is the average stock market return?
 0:06:02
How to estimate the mean, variance, and standard deviation from a sample of stock returns
 0:06:03
Introduction to Descriptive Statistics
 0:00:14
3 Months Data Analyst Roadmap #roadmap #shorts #dataanalyst
 0:18:04
Stock return frequency distributions and histograms in Excel | Financial Modeling Tutorials
 0:02:40
Group Summary Statistics of Stock Returns by Year
 0:01:00
How To Know When To Buy And Sell Stocks #shorts
 0:03:25
Descriptive Statistics in Excel
 0:00:05
Statistics Formulas -1
Комментарии