filmov
tv
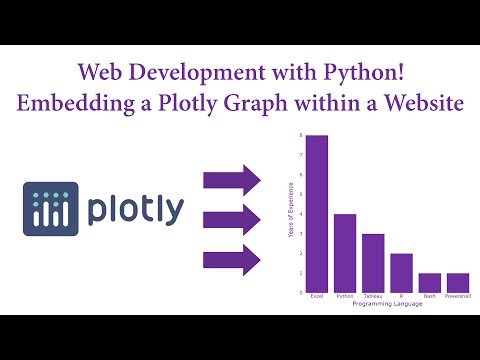
Web Development with Python! Embedding a Plotly Graph within a Website

Показать описание
Tutorial on how to embed a Plotly graph within an HTML website hosted on GitHub Pages. Learn how to generate a Plotly graph, download the graph as an HTML file and code the graph in to a website.
The notebook can be found in the "Web Development" folder within the below repo.
CONNECT:
|-Video Chapters-|
0:00 - Intro
0:35 - Creating a bar chart within Plotly
2:58 - Exporting Plotly to a HTML file
3:39 - Uploading the HTML file to website's GitHub Rep
4:31 - Embedding the graph using HTML
6:24 - References and additional learning
 0:04:19
PyScript | Run Python in your HTML | Write your first PyScript Program in VSCode | PYTHON in BROWSER
 0:15:34
How to embed the Bokeh Chart in a Webpage with python.
 0:06:47
Web Development with Python! Embedding a Plotly Graph within a Website
 0:01:00
Don’t learn web dev this way
 0:02:47
Embedding Python Code into Webpage | PyScript
 0:11:11
Pygal SVG embedded Graphs - Flask Web Development with Python 33
 0:00:50
Dark Days Before Docker #javascript #python #web #coding #programming
 0:01:04
I Create Dashboard in One Minute using Python | Python for beginners | #python #coding #programming
 0:03:46
Video Editing, Graphics Design, Web Dev., Artificial Intelligence, Public Sepaking । Ruchi Solution...
 0:11:30
What Can You Do with Python? - The 3 Main Applications
 0:16:48
Embedding Plotly Charts into Django Web Apps: Step by Step Guide | Python
 0:00:09
Web Developer's Life be Like!
 2:16:40
Python Website Full Tutorial - Flask, Authentication, Databases & More
 0:00:30
Front-End Developer Roadmap - From Novice to Front-End Expert
 0:06:43
How To Embed Online IDE In Your Web Site | Embed IDE In Site | All In One Code
 0:00:58
How Rust Fixed Discord’s Latency Issues #javascript #python #web #coding #programming
 0:00:16
Best Programming Languages #programming #coding #javascript
 0:00:10
What a typical day of a programmer can look like 💻 #coder #softwareengineer
 0:05:29
How to import external python file in HTML using pyscript tutorial
 0:09:25
Where Lua Is Actually Used
 0:00:28
Developer Last Expression 😂 #shorts #developer #ytshorts #uiux #python #flutterdevelopment
 0:00:48
Top 5 programming courses
 0:00:17
Amazing Rotating Python Graphics Design using Turtle 🐢 #python #pythonshorts #coding #viral #design...
 0:06:04
Build better payment forms using new “embedded” Stripe Checkout
Комментарии