filmov
tv
Single Slit Fraunhofer Diffraction - Curve of intensity

Показать описание
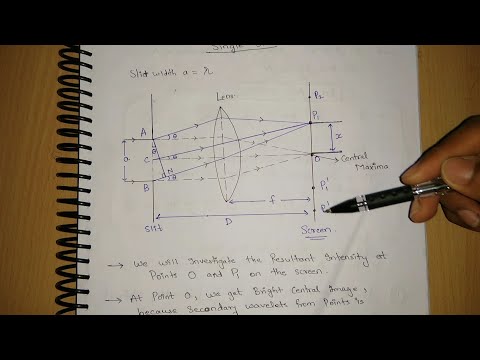
In the curve of intensity of the single slit Fraunhofer diffraction, the intensity I is maximum at the center O of the central bright fringe. The intensity decreases as one moves from O in both directions of the sinθ axis until it vanishes completely at the centers of the first dark fringes. The intensity increases again until it reaches a new maximum at the centers of the first bright fringes and so on.
The intensities at the centers of the bright fringes are much less than that at the center of the central bright fringe, and these intensities decrease as one moves away on both sides of the central fringe.
You can watch:
The intensities at the centers of the bright fringes are much less than that at the center of the central bright fringe, and these intensities decrease as one moves away on both sides of the central fringe.
You can watch:
 0:13:35
Fraunhofer Diffraction Explained
 0:12:51
Fraunhofer Diffraction due to Single Slit
 0:06:48
Single-Slit Fraunhofer Diffraction
 0:00:55
Single slit diffraction with a laser
 0:08:47
Maxima in Single slit diffraction | Wave optics | Physics | Khan Academy
 0:02:20
Fraunhofer diffraction at single slit (Part 1)
 0:17:18
Fraunhofer Diffraction due to single slit
 0:11:15
Fraunhoffer Diffraction at a Single Slit
 0:05:22
Physics - Optics: Single Slit Diffraction (1 of 15) Basics
 0:26:52
FRAUNHOFER DIFFRACTION AT A SINGLE SLIT || DIFFRACTION AT A SINGLE SLIT || PART - 1 || WITH NOTES ||
 0:21:26
fraunhofer diffraction due to single slit
 0:25:03
Fraunhofer's Diffraction due to Single Slit, Full Derivation, #aktu #btech #bcs
 0:26:37
Part-1 Fraunhofer diffraction by single slit complete derivation l Dr. Avani pareek
 0:18:12
Diffraction due to narrow slit class 11 | Fraunhofer Diffraction class 11 | single slit diffraction
 0:09:02
LASER Diffraction (Diffraction at a single slit)
 0:27:17
Fraunhofer|Diffraction|Single|Slit|Physics 12|Tamil|Muruga MP
 0:26:18
DIFFRACTION DUE TO SINGLE SLIT
 0:07:46
Diffraction | Single Slit | @MokkaPhysics Inbaraj Sir
 0:27:04
Physics | Fraunhofer diffraction at Single Slit and Double Slit
 0:12:33
OP4.2.Fraunhofer Diffraction Single slit
 0:24:25
FRAUNHOFER DIFFRACTION AT A SINGLE SLIT || DIFFRACTION AT A SINGLE SLIT || PART - 2 || WITH NOTES ||
 0:23:17
Fraunhofer diffraction due to single slits
 0:17:37
Fraunhofer diffraction at single slit | Engineering Physics | Module 2 - Part5 | KTU
 0:02:11
Diffraction of light || Animated explanation in || Wave Optics|| Physics 12th class
Комментарии