filmov
tv
Stochastics Explained - This Technical Indicator Improves Trades!

Показать описание
💯 LET’S CONNECT 💯
👇 👇 Watch My Other Videos Here 👇 👇
★ How I Find Winning Stocks (Analysis For Active Traders)
★ How to Swing Trade Stocks (THE BASICS)
★ How to Trade Pre-Market & After Hours -- Extended Hours Trading Explained
================
Stochastic Oscillator
What Is a Stochastic Oscillator?
A stochastic oscillator is a momentum indicator comparing a particular closing price of a security to a range of its prices over a certain period of time. The sensitivity of the oscillator to market movements is reducible by adjusting that time period or by taking a moving average of the result. It is used to generate overbought and oversold trading signals, utilizing a 0–100 bounded range of values.
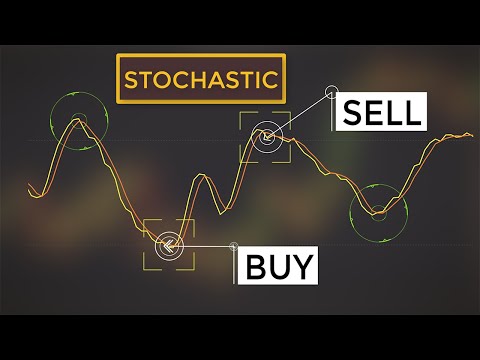
Stochastics: An Accurate Buy and Sell Indicator
In the late 1950s, George Lane developed stochastics, an indicator that measures the relationship between an issue's closing price and its price range over a predetermined period of time. To this day, stochastics is a favored technical indicator because it is easy to understand and has a high degree of accuracy in indicating whether it's time to buy or sell a security.
Price Action
The premise of stochastics is that when a stock trends upwards, its closing price tends to trade at the high end of the day's range or price action. Price action refers to the range of prices at which a stock trades throughout the daily session. For example, if a stock opened at $10, traded as low as $9.75 and as high as $10.75, then closed at $10.50 for the day, the price action or range would be between $9.75 (the low of the day) and $10.75 (the high of the day). Conversely, if the price has a downward movement, the closing price tends to trade at or near the low range of the day's trading session.
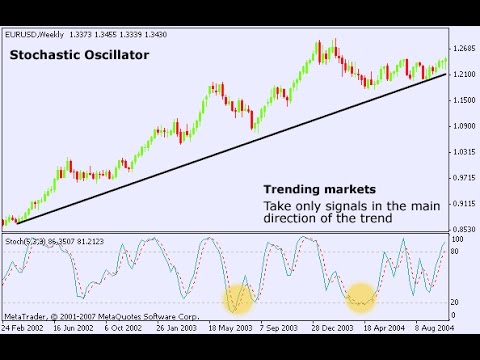
Stochastics is used to show when a stock has moved into an overbought or oversold position. Fourteen is the mathematical number most often used in the time mode. Depending on the technician's goal, it can represent days, weeks, or months. The chartist may want to examine an entire sector. For a long-term view of a sector, the chartist would start by looking at 14 months of the entire industry's trading range.
Relative Strength Index
Jack D. Schwager, a board member of Fund Seeder and author of several books on technical analysis, uses the term "normalized" to describe stochastic oscillators that have predetermined boundaries, both on the high and low sides.
An example of such an oscillator is the relative strength index (RSI)—a popular momentum indicator used in technical analysis—which has a range of 0 to 100. It is usually set at either the 20 to 80 range or the 30 to 70 range. Whether you're looking at a sector or an individual issue, it can be very beneficial to use stochastics and the RSI in conjunction with each other.
Formula
Stochastics is measured with the K line and the D line. But it is the D line that we follow closely, for it will indicate any major signals in the chart. Mathematically, the K line looks like this:
%K=100× (H14−L14/CP−L14)
where:
CP=Most recent closing price
L14=Lowest price of the 14 previous trading sessions
H14=Highest price of the same 14 previous trading sessions
The formula for the more important D line looks like this:
D=100(L3/H3)
where:
H3=Highest of the three previous trading sessions
L3=Lowest price traded during the same three-day period
================
📧 E-mail me at: JakeBroeYT [at] gmail [dot] com
Official business inquiries can be sent here. Personal e-mails will be discarded.
================
#Stochastics #StochasticOscillator #StockMarket
================
DISCLAIMER:
This video is for entertainment purposes only. I am not a legal or financial expert or have any authority to give legal or financial advice. While all the information in this video is believed to be accurate at the time of its recording, realize this channel and its author makes no express warranty as to the completeness or accuracy, nor can it accept responsibility for errors appearing in this video.
ADVERTISER DISCLOSURE:
 0:14:35
Stochastics Explained - This Technical Indicator Improves Trades!
 0:04:31
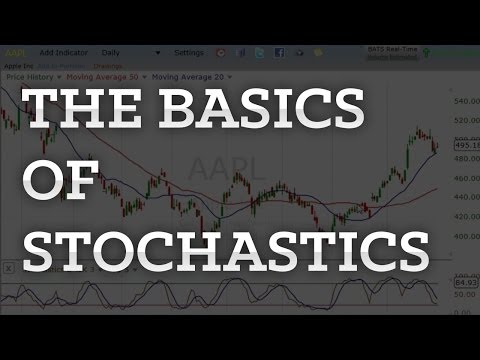
The Basics of Stochastics Trading Explained Simply In 4 Minutes
 0:12:31
Ultimate Stochastic Oscillator Indicator Trading Strategy (This Changes Everything!)
 0:12:36
The Stochastic Oscillator Explained
 0:03:35
How to Read Stochastic RSI Indicator|Explained For Beginners
 0:07:37
STOCHASTICS: What is a Stochastic and Why Stick to the Rules
 0:09:20
BEST Stochastic Indicator Strategy for Daytrading Forex & Stocks (Easy Pullback Strategy)
 0:09:42
Stochastic Indicator Explained for Beginners - Create a Stochastic Strategy
 0:04:04
Trading CADCHF With A Stochastic Process (Shout Out John Kurisko)
 0:07:44
Stochastic RSI Trading Strategy
 0:27:20
Stochastic Technical Indicator Analysis in Hindi. Technical Analysis in Hindi
 0:00:53
How To Use STOCHASTIC Oscillator In Trading [ STOCHASTIC Indicator Trading Strategy ]
 0:10:41
Stochastic Indicator Explained for Beginners| Technical Analysis Education
 0:02:05
What is The Stochastic Oscillator?
 0:06:03
Stochastic Trading Strategy for Stock Trading | Trading Strategy For Beginners
 0:07:15
Stochastic Indicator Crossover Explained: %K and %D Lines
 0:00:29
stochastic rsi trading strategy #shorts
 0:09:00
Stochastic Indicator Explained: Fast, Slow, & Full Stochastics / Oscillator Strategy Tutorial Ba...
 0:08:54
Stochastic Oscillator Explained - Technical Tuesdays
 0:11:00
🔴 The 'RSI-MACD-STOCHASTIC' PRICE ACTION SECRET That No One Will Tell You...(BEGINNER TO E...
 0:16:49
Technical Analysis 101: Stochastic Oscillator | VectorVest
 0:11:57
DELETE Your Stochastic RSI Now! Use THIS For 10X Gains
 0:11:52
💯 EFFECTIVE STOCHASTIC INDICATOR STRATEGY | Stochastic Oscillator | Stochastic Trading Strategy
 0:11:10
Most Effective Strategies To Trade With Stochastic Indicator (Forex & Stock Trading)
Комментарии