filmov
tv
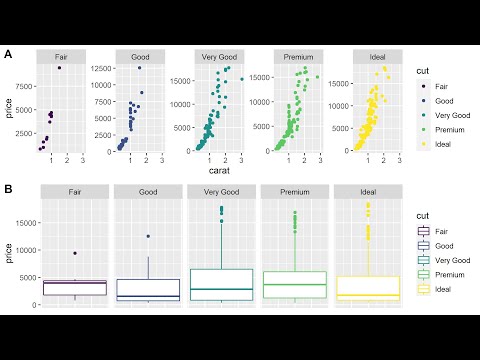
Plotting in R using ggplot2: Legend positions and colors (Data Visualization Basics in R #28)

Показать описание
Today we will be looking at how to change legend positions and move it inside the plots, how to make legends appear vertical and how to change the background color and borders of legends while using ggplot2 package in R. For similar videos on data visualization, check out my “Data Visualization in R Tutorial Video Series”; you can find the link to the playlist below:
If you are a beginner interested in learning data analysis in R, check our my “Data Analysis Basics in R Tutorial Video Series” as well. The link is attached below. Enjoy!!!
----------------------------------------
Other related videos/links:
# Data Visualization Basics in R
----------------------------------------
# Data Analysis Basics in R
----------------------------------------
# More about R
----------------------------------------
# GIS/Remote Sensing
----------------------------------------
 0:26:51
ggplot for plots and graphs. An introduction to data visualization using R programming
 0:29:17
Learn to plot Data Using R and GGplot2: Import, manipulate , graph and customize the plot, graph
 0:00:14
Tips in using R: quick plot using ggplot2
 0:22:28
Scatter plot and Line plot in R (using ggplot2)
 0:04:07
Plotting in R using ggplot2: Plotting multiple plots (Data Visualization Basics in R #26)
 0:18:39
Graphics in R with ggplot()
 0:16:02
ggplot2 Tutorial | ggplot2 In R Tutorial | Data Visualization In R
 0:05:37
ggplot2 explained in 5 minutes!
 5:26:32
R programming data visualization with ggplot2 part 74
 0:04:26
Plotting in R using ggplot2: Ribbon plots (Data Visualization Basics in R #15)
 0:06:13
Plot maps and graphs in r using ggplot2
 0:02:31
Plotting in R using ggplot2: Stacked Density plots (Data Visualization Basics in R #11)
 0:13:28
How to draw a line graph using ggplot with R programming. Plots and graphs to visualize data.
 0:10:18
Make Beautiful Graphs in R: 5 Quick Ways to Improve ggplot2 Graphs
 0:12:18
Multi-Panel Plots in R (using ggplot2)
 0:13:03
Barplot and column plot using R (ggplot)
 0:18:11
Visualize your data using ggplot. R programming is the best platform for creating plots and graphs.
 0:07:59
Plot in R :Adding data labels to R plots, Data Visualization using R , GGplot2, P
 0:09:57
Advanced ggplot #2 - create beautiful plots and graphs using R programming.
 0:02:07
Plotting in R using ggplot2: Frequency plots (Data Visualization Basics in R #14)
 0:00:35
R GRAPHICS TRICK !!! #shorts #rstats #datavisualization #dataviz #programming #ggplot2
 0:27:07
Insightful Data Visualization Using ggplot2 in R (Ft. @rappa753 ) | Drawing Advanced Plots & Gra...
 0:02:35
Plotting in R using ggplot2: Stacking area plots (Data Visualization Basics in R #8)
 0:32:05
Plotting in R tutorial: Gorgeous graphs with ggplot2
Комментарии