filmov
tv
How to Make Heatmap in Excel ArcGIS Add In
Показать описание
#excel #arcgis #arcgisforexcel #howto
Just a simple video showing you how to create a heatmap in ArcGIS for Excel.
This video is just a blog and does not represent anyone other than myself.
Steps to Create a Heat Map Using ArcGIS for Excel
Introduction (0:00 - 0:05)
Brief overview of what will be covered in the video.
Prepare Your Data and Layers (0:06 - 0:30)
Ensure your Excel sheet has the data ready.
Add a layer with the location points.
Creating a Heat Map (0:31 - 0:45)
Select the layer and choose to display it as a heat map.
Compare the difference between location points and the heat map view.
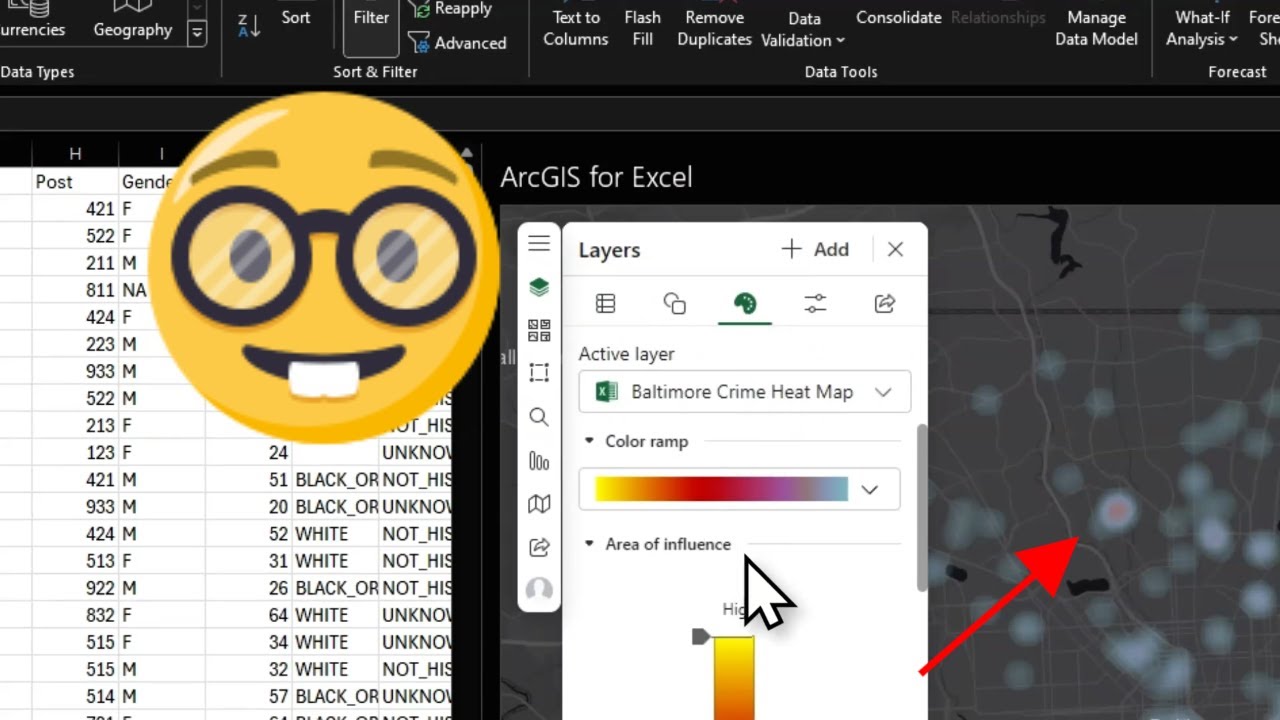
Adjusting Color Ramp (0:46 - 1:20)
Access the color palette to pick your preferred color ramp.
Options include "red hot, blue cold" or other combinations like "purple and gold."
Modify the colors to highlight high and low areas effectively.
Modifying Heat Map Settings (1:21 - 1:50)
Adjust the blur radius for a more concentrated or dispersed heat map.
Tweak the settings to ensure the heat map visibility aligns with your data needs.
Layer Visibility and Properties (1:51 - 3:15)
Toggle between different layers to show or hide them as needed.
Zoom in to see detailed points, zoom out to see the heat map.
Change layer visibility properties to manage when layers become visible.
Set the visible range to control at what zoom levels the heat map and points appear.
Using Heat Maps for Data Exploration (3:16 - 3:30)
Utilize heat maps to identify pockets of activity.
Investigate specific areas highlighted by the heat map to find detailed incidents or data points.
Just a simple video showing you how to create a heatmap in ArcGIS for Excel.
This video is just a blog and does not represent anyone other than myself.
Steps to Create a Heat Map Using ArcGIS for Excel
Introduction (0:00 - 0:05)
Brief overview of what will be covered in the video.
Prepare Your Data and Layers (0:06 - 0:30)
Ensure your Excel sheet has the data ready.
Add a layer with the location points.
Creating a Heat Map (0:31 - 0:45)
Select the layer and choose to display it as a heat map.
Compare the difference between location points and the heat map view.
Adjusting Color Ramp (0:46 - 1:20)
Access the color palette to pick your preferred color ramp.
Options include "red hot, blue cold" or other combinations like "purple and gold."
Modify the colors to highlight high and low areas effectively.
Modifying Heat Map Settings (1:21 - 1:50)
Adjust the blur radius for a more concentrated or dispersed heat map.
Tweak the settings to ensure the heat map visibility aligns with your data needs.
Layer Visibility and Properties (1:51 - 3:15)
Toggle between different layers to show or hide them as needed.
Zoom in to see detailed points, zoom out to see the heat map.
Change layer visibility properties to manage when layers become visible.
Set the visible range to control at what zoom levels the heat map and points appear.
Using Heat Maps for Data Exploration (3:16 - 3:30)
Utilize heat maps to identify pockets of activity.
Investigate specific areas highlighted by the heat map to find detailed incidents or data points.
 0:05:55
Create a Heat Map in Excel
 0:05:29
How To: Create an Excel Risk Heatmap
 0:03:43
How to Create a Heatmap in Excel (THE EASY WAY)
 0:10:03
How to Create a Heat Map with Excel
 0:05:01
Creating a Heatmap in Excel
 0:04:33
Creating a Heatmap in QGIS - Heatmap Tutorial
 0:00:40
How to Create a Heatmap
 0:00:33
How to make a heatmap in Excel! #exceltips #tutorial
 1:22:52
Heatmaps 101: Data Visualization Ka Sahi Tarika
 0:08:58
Make a simple heatmap of differentially expressed genes in R
 0:00:26
Learn Excel: How to Make a Heatmap.
 0:03:43
How to Make Heatmap in Excel ArcGIS Add In
 0:00:10
Excel heatmap
 0:01:48
How to create a Heatmap in Google Sheets
 0:21:19
Big Heatmap Tutorial | Maplibre, Mapbox, Leaflet, Google Maps | Proximity, Weighted, and Cell
 0:08:28
Seaborn Heatmap - How to Visualise Correlations and Data With Heatmaps in Python
 0:00:22
How to do a Thermal Heatmap Color Video Effect!
 0:03:15
How to make a heatmap using datasets in MAPBOX
 0:13:03
Seaborn heatmap | How to make a heatmap in Python Seaborn and adjust the heatmap style
 0:00:15
heatmap in Rstudio #coding
 0:03:05
How do I create a heatmap in Power BI?
 0:00:18
One click to create a heat map #exceltips #heatmap #conditionalformatting #colorscale
 0:02:09
How To: Create a Stunning Heatmap in Excel – Step-by-Step Guide!
 0:02:12
How to make an Heat Map using GraphPad Prism #heatmap #graphpad
Комментарии