filmov
tv
Flood Frequency Analysis - Part 1

Показать описание
This video describes flood frequency analysis (FFA) using historical data, including explanation of annual maximum and partial duration series. Two simple methods, including computing recurrence interval and ranking or plotting position, for performing FFA are explained.
 0:14:50
Flood Frequency Analysis – Part 1: Download and Import
 0:20:18
Flood Frequency Analysis - Part 1
 0:19:19
Flood Frequency Analysis Tutorial in Excel using Gumbel's Method
 0:14:16
Flood Frequency Analysis Basics
 0:11:43
Assignment on Simple Flood Frequency Analysis
 0:09:11
Flood Frequency Analysis – Part 2: Exceedance Probability
 0:29:42
Flood Frequency Analysis – Part 3: Log Pearson III Distribution
 0:07:00
Flood Frequency Analysis (Part 1)
 0:16:53
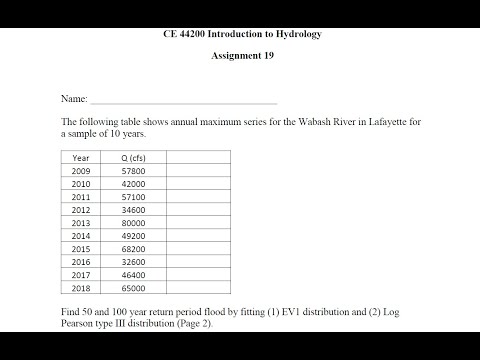
Assignment 19 - Flood Frequency Analysis using Extreme Value 1 and Log Pearson Type 3 Distributions
 0:24:29
Flood Frequency Analysis
 0:01:19
Flood Frequency Analysis video
 0:01:41
Frequency Analysis in Hydrology
 0:17:21
Flood frequency analysis: cautionary notes and examples
 0:33:19
Flood Frequency Analysis - Part 2
 0:08:31
Flood Frequency Analysis (Part 2)
 0:30:01
Lecture 2 Flood Frequency
 0:05:30
Flood Frequency Analysis Just in 5 Minutes Using Online Tools
 0:11:11
Introduction to using probability for flood frequency analysis
 0:04:26
Regional Flood Frequency Estimation
 0:58:26
FREQUENCY ANALYSIS in Hydrology
 0:08:06
Flood Frequency Analysis using GloFAS Datasets and Easy Fit Software Course_Part2
 0:22:09
Hydrology - Log Pearson Type III Flood Frequency Analysis Walkthrough
 0:00:51
Unlock the full power of Flood Frequency Analysis with RMC-BestFit
 0:03:21
Flood Frequency Analysis - Kirti Sehgal
Комментарии