filmov
tv
Lab 8: Electronic Band Structure Calculation and Plot

Показать описание
I have tried to make video in a way that ordinary people who are not familiar with Quantum Espresso can understand in common language, I am sorry if there is any error in this video, in this video I have given general information about "Electronic Band Structure Calculation and Plot"
Download pseudopotentail :
=================
&CONTROL
calculation = 'scf'
prefix = 'graphite'
pseudo_dir = '.'
outdir = 'data'
verbosity = 'high'
/
&SYSTEM
celldm(1) = 4.660800451
celldm(3) = 3.164154417
degauss = 1.00000e-02
ecutrho = 4.50000e+02
ecutwfc = 5.00000e+01
ibrav = 4
nat = 4
ntyp = 1
nbnd=16
occupations = "smearing"
smearing = "gaussian"
/
&ELECTRONS
/
K_POINTS {automatic}
6 6 2 0 0 0
ATOMIC_SPECIES
C 12.01070 C.pbe-n-rrkjus_psl.1.0.0.UPF
ATOMIC_POSITIONS (crystal)
C -0.000000000 -0.000000000 0.250000000
C 0.000000000 -0.000000000 0.750000000
C 0.333333000 0.666667000 0.250000000
C 0.666667000 0.333333000 0.750000000
=========================
&CONTROL
calculation = 'bands'
prefix = 'graphite'
pseudo_dir = '.'
outdir = 'data'
verbosity = 'high'
/
&SYSTEM
celldm(1) = 4.660800451
celldm(3) = 3.164154417
degauss = 1.00000e-02
ecutrho = 4.50000e+02
ecutwfc = 5.00000e+01
ibrav = 4
nat = 4
ntyp = 1
nbnd=16
occupations = "smearing"
smearing = "gaussian"
/
&ELECTRONS
/
! G—M—K—G—A—L—H—A|L—M|H—K comment
K_POINTS {crystal_b}
12
gG 20
M 20
K 20
gG 20
A 20
L 20
H 20
A 0
L 20
M 0
H 20
K 0
ATOMIC_SPECIES
C 12.01070 C.pbe-n-rrkjus_psl.1.0.0.UPF
ATOMIC_POSITIONS (crystal)
C -0.000000000 -0.000000000 0.250000000
C 0.000000000 -0.000000000 0.750000000
C 0.333333000 0.666667000 0.250000000
C 0.666667000 0.333333000 0.750000000
==================
&bands
prefix = 'graphite',
outdir = 'data',
/
 0:22:11
Lab 8: Electronic Band Structure Calculation and Plot
 0:06:57
Lab 11: How to draw Electronic Band Structure without any external software?
 0:06:03
Lab 10: Electronic Band Structure and DOS side by side in single plot. (For publication)
 0:15:01
Electronic Band Structure Calculation using Quantum ESPRESSO
 0:49:56
Plotting Band Structure and Density of States using Origin Pro.
 0:12:23
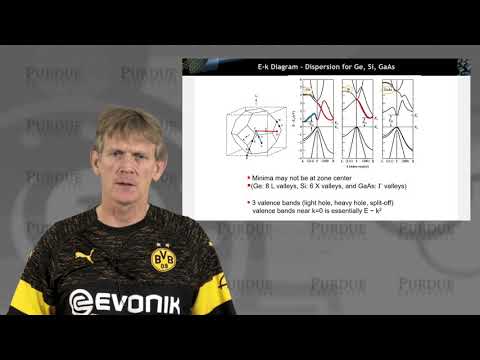
ECE 606 Solid State Devices L10.1: Bandstructure - E(k) Diagrams in Specific Crystal Directions
 0:04:54
How to calculate electronic band-structure using AMS BAND
 0:01:17
Exabyte.io Tutorial: Electronic Band Structure
 0:30:31
Lecture 29 1D Band Structures Part 1
 0:00:16
Lung inflation in Science Lesson #science #teacher #biology
 0:19:47
L49.3 Band structure in quantum mechanics
 0:51:06
ABACUS Band Structure Models (Spring 2022)
 1:26:35
Lecture 22: Metals, Insulators, and Semiconductors
 0:00:55
3D Printing is SLOW?| FLSUN V400
 0:03:01
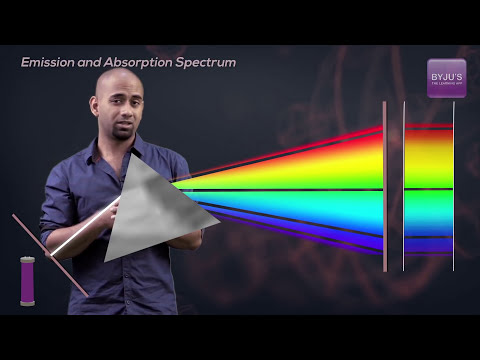
Emission and Absorption Spectrum: JEE Chemistry Concepts Explained | Class 11th Chemistry | JEE 2023
 0:23:51
How to plot the band structure using origin
 0:00:39
PeriodicPotential lab
 0:37:54
Spin Resolved Electronic Band Structure and Density of States for Bulk Fe
 0:07:30
Effective mass calculation by computing band structure curve
 0:10:49
Electronic band structure and DOS calculation of silicon(Si) with quantum espresso part 1
 0:06:50
ECE 606 Solid State Devices L11.1: Bandstructure Measurements
 0:01:49
Build a Wind Turbine | Windmill #EarthMonth Activities for Kids
 0:27:01
From The Meter Bar to The Band Gap Voltage Reference
 0:07:22
How to use a BreadBoard - Electronics Basics 10
Комментарии