filmov
tv
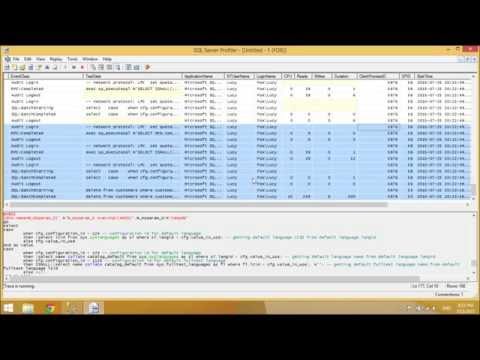
Capture trace data with SQL Server Event Profiler

Показать описание
ℹ️ dbForge Event Profiler by Devart is a FREE and powerful tool that allows you to сapture and replay SQL Server trace data. See how you can use a trace file to find and troubleshoot SQL Server deadlocks
Get familiar with the main features of SQL Server Event Profile:
🔎 Diverse customization options located on the wizard tabs
🔎 Events to Capture to select the events you need
🔎 Event Filters to perform in-depth customization of the events you have selected earlier
🔎 Columns to configure the resulting data grid layout.
🔎 Sort and filter events by any column value
🔎 Copy queries from the events you are interested in into SQL documents, execute them and view the results
🔎 Event Profiler document to quickly open a saved project with all your settings and continue analyzing your server problems
Timestamps:
00:00 Introduction
00:15 SQL Server profiler Start page
00:40 Server profile document
00:58 Analyzing the results
01:10 Sort and filter events
01:39 Copy selected queries into SQL documents, execute them, and view the results
01:52 Quickly open the saved profile session project from the Start page
🔗 Find more useful information about dbForge Event Profiler here:
🔥 For downloading a FREE product:
🔔 Don't forget to subscribe to our channel!
 0:02:16
 0:03:02
 0:04:03
 0:11:26
 0:01:08
 0:14:52
 0:04:33
 0:10:21
 0:13:50
 0:04:56
 1:05:16
 0:11:27
 0:07:33
 0:08:03
 0:05:26
 1:17:28
 0:00:06
 0:49:50
 0:10:06
 0:03:02
 0:34:10
 0:08:32
 0:23:45
 0:13:36