filmov
tv
Dynamic Tracking for Finding #MariaDB (and #MySQL) Performance Problems on #Linux -Percona Live 2020

Показать описание
Comment 💬, Share 🔗, Like 👍🏻, and Subscribe ✅ to our channel
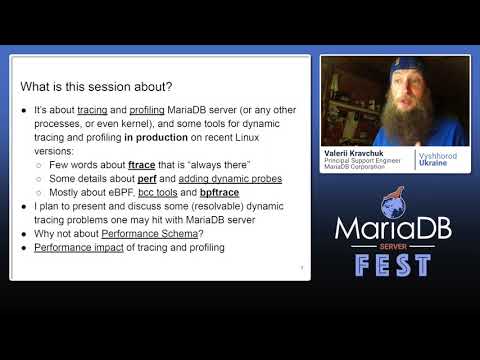
Valeriy Kravchuk talked about While troubleshooting #MariaDB server performance problems it is important to find out where the time is spent in the #mysqld process, on-CPU and off-CPU. The process of investigation should have as small influence as possible on the server we try to troubleshoot.
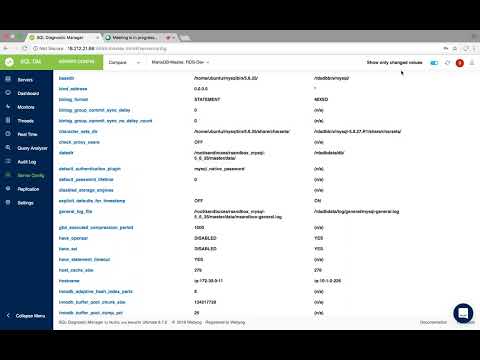
Performance_schema introduced in #MySQL 5.5 (and inherited from #MySQL 5.6 by #MariaDB) is supposed to provide detailed enough instrumentation for most cases. But it comes with a cost, requires careful sizing of performance counters, and the process of instrumenting the code is not yet complete even for MySQL 8, to say nothing about #MariaDB with its 3rd party storage engines, plugins and libraries like #Galera.
This is when perf profiler and, on recent Linux kernels (4.9+) eBPF and bpftrace tools come handy.
Specifically, perf profiler and ftrace interface can be easily used while studying MariaDB performance problems. Basic usage steps are presented and several typical real life use cases (including adding dynamic probes to almost any line of MariaDB code) are discussed.
On Linux 4.9+ eBPF is probably the most powerful and least intrusive way to study performance problems. Basic usage of , bcc tools and bpftrace, as well as main #bpftrace features and commands are demonstrated.
One of the ways to present and study stack samples collected by perf or bpftrace, Flame Graphs, is also presented with examples coming from my experince as a support engineer.
You can find more about #MariaDB and #MySQL support and Percona Live Online 2020 in these links 👇🏻👇🏻👇🏻
Connect With us on our Social Networks 👇🏻👇🏻👇🏻
 0:58:00
 1:01:01
 0:22:05
 0:04:43
 0:09:40
 0:26:00
 0:05:57
 0:11:22
 0:03:18
 0:13:14
 0:35:15
 0:27:34
 0:04:16
 0:46:55
 0:40:57
 1:07:03
 0:05:22
 0:57:45
 0:13:27
 0:06:46
 0:07:24
 0:02:35
 1:08:37
 0:27:21