filmov
tv
Hypothesis Testing: Null & Alternative Hypothesis I Statistics 101 #2 | MarinStatsLectures

Показать описание
Hypothesis Testing: Null and Alternative Hypothesis (one sample t test)!
In the second video in Statistics 101 Hypothesis Testing series, we will learn about the null and alternative hypotheses and how they are set up in a hypothesis test in the context of a one-sample t-test.
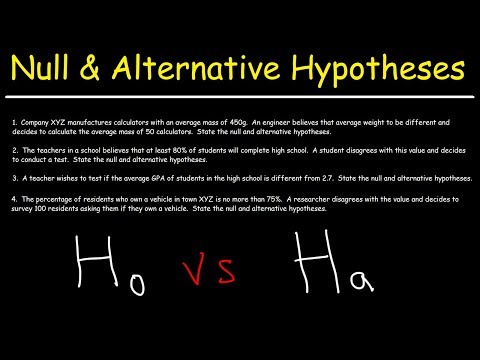
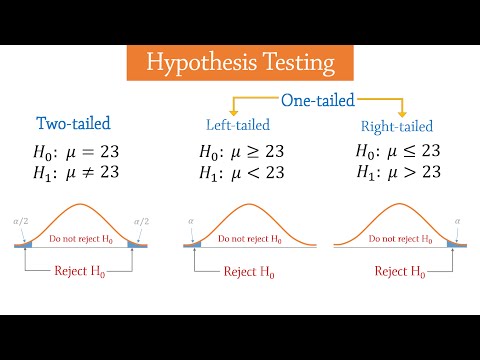
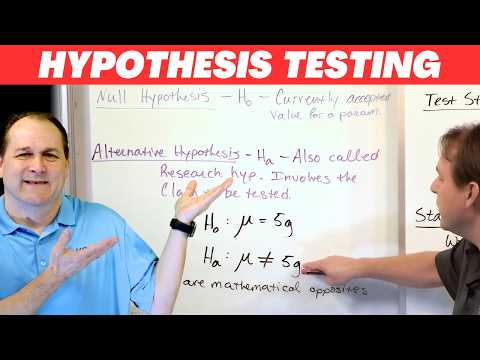
►Hypothesis testing works by first specifying a Null Hypothesis and an Alternative Hypothesis. The Null hypothesis is generally a statement of “no change” or “nothing interesting happening here”, while the Alternative hypothesis is generally what we are interested in “proving”, or more correctly, what we are interested in “providing evidence for”. Hypothesis tests generally start by assuming the Null hypothesis to be true, and then proceed to work out how likely we would have been to observed what we did in our sample (the sample statistic, or sample mean in this case) if the Null hypothesis were in fact true. This “how likely we were to observe it” is known as a p value.
►The One Sample t Test helps us decide whether or not we believe the sample mean is statistically different from a known or hypothesized population mean. The One Sample t Test is a parametric test. This test is also known as: Single Sample t Test or Student’s t test or when one assumes the population standard deviation is known, it is called the Z test. The test works by calculating a test statistic that measures how compatible the sample statistic (the sample mean in this case) is with the value that would be expected for the sample statistic if the null hypothesis were in fact true (the null hypothesized value). A p value is then calculated. The p value tells us the probability of obtaining a sample statistic as far, or further, from the null hypothesized value, if the null hypothesis were in fact true. The p value helps us decide whether or not we will believe the null hypothesis to be true or not.
In this set of tutorials (Statistics 101), you will learn the concept of a null and alternative hypothesis, how a test statistic can be used to measure the compatibility of our data with the null hypothesis, the use of a significance level and p-values or critical regions, conclusions that we can make as well as the errors that may be made when drawing our conclusions.
►► Watch More:
Follow MarinStatsLectures
Our Team:
Content Creator: Mike Marin (B.Sc., MSc.) Senior Instructor at UBC.
Producer and Creative Manager: Ladan Hamadani (B.Sc., BA., MPH)
These videos are created by #marinstatslectures to support some courses at The University of British Columbia (UBC) (#IntroductoryStatistics and #RVideoTutorials for Health Science Research), although we make all videos available to the everyone everywhere for free.
Thanks for watching! Have fun and remember that statistics is almost as beautiful as a unicorn!
In the second video in Statistics 101 Hypothesis Testing series, we will learn about the null and alternative hypotheses and how they are set up in a hypothesis test in the context of a one-sample t-test.
►Hypothesis testing works by first specifying a Null Hypothesis and an Alternative Hypothesis. The Null hypothesis is generally a statement of “no change” or “nothing interesting happening here”, while the Alternative hypothesis is generally what we are interested in “proving”, or more correctly, what we are interested in “providing evidence for”. Hypothesis tests generally start by assuming the Null hypothesis to be true, and then proceed to work out how likely we would have been to observed what we did in our sample (the sample statistic, or sample mean in this case) if the Null hypothesis were in fact true. This “how likely we were to observe it” is known as a p value.
►The One Sample t Test helps us decide whether or not we believe the sample mean is statistically different from a known or hypothesized population mean. The One Sample t Test is a parametric test. This test is also known as: Single Sample t Test or Student’s t test or when one assumes the population standard deviation is known, it is called the Z test. The test works by calculating a test statistic that measures how compatible the sample statistic (the sample mean in this case) is with the value that would be expected for the sample statistic if the null hypothesis were in fact true (the null hypothesized value). A p value is then calculated. The p value tells us the probability of obtaining a sample statistic as far, or further, from the null hypothesized value, if the null hypothesis were in fact true. The p value helps us decide whether or not we will believe the null hypothesis to be true or not.
In this set of tutorials (Statistics 101), you will learn the concept of a null and alternative hypothesis, how a test statistic can be used to measure the compatibility of our data with the null hypothesis, the use of a significance level and p-values or critical regions, conclusions that we can make as well as the errors that may be made when drawing our conclusions.
►► Watch More:
Follow MarinStatsLectures
Our Team:
Content Creator: Mike Marin (B.Sc., MSc.) Senior Instructor at UBC.
Producer and Creative Manager: Ladan Hamadani (B.Sc., BA., MPH)
These videos are created by #marinstatslectures to support some courses at The University of British Columbia (UBC) (#IntroductoryStatistics and #RVideoTutorials for Health Science Research), although we make all videos available to the everyone everywhere for free.
Thanks for watching! Have fun and remember that statistics is almost as beautiful as a unicorn!
 0:06:52
Hypothesis Testing - Null and Alternative Hypotheses
 0:04:29
Hypothesis testing. Null vs alternative
 0:03:49
Null and alternative hypotheses with Lindsey Leach
 0:14:41
Hypothesis Testing and The Null Hypothesis, Clearly Explained!!!
 0:14:52
Null and Alternate Hypothesis - Statistical Hypothesis Testing - Statistics Course
 0:01:59
Statistical Significance, the Null Hypothesis and P-Values Defined & Explained in One Minute
 0:05:42
Examples of null and alternative hypotheses | AP Statistics | Khan Academy
 0:02:13
Hypothesis Testing in Business: Null vs. Alternative
 0:29:04
Types of Hypothesis || Research Aptitude || UGC NET PAPER - 1 || CLASS-7 BY SUNDER PAL SIR
 1:08:17
Hypothesis testing (ALL YOU NEED TO KNOW!)
 0:09:50
Alternative Hypotheses: Main Ideas!!!
 0:04:00
Hypothesis Testing - Introduction
 0:13:34
Hypothesis Testing Problems - Z Test & T Statistics - One & Two Tailed Tests 2
 0:04:03
Difference Between Null and Alternative Hypothesis | Example | Definition | Step by step Guide
 0:13:43
Developing the Null and Alternative Hypotheses
 0:02:42
Null and Alternative Hypotheses
 0:02:06
Hypothesis Testing: Null & Alternative Hypothesis I Statistics 101 #2 | MarinStatsLectures
 0:08:06
Hypothesis Testing Statistics Null and Alternative: With Examples
 0:01:58
Null hypothesis explained
 0:06:36
Hypothesis [Research Hypothesis simply explained]
 0:13:59
Null and Alternative Hypotheses
 0:23:41
Intro to Hypothesis Testing in Statistics - Hypothesis Testing Statistics Problems & Examples
 0:00:51
Hypothesis Testing 🔥 Explained in 60 Seconds
 0:09:58
Idea behind hypothesis testing
Комментарии