filmov
tv
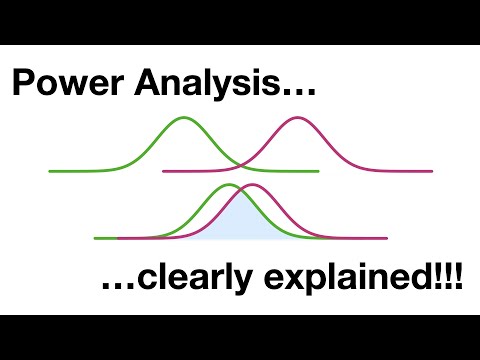
Power Analysis, Clearly Explained!!!

Показать описание
If you're doing an experiment, a Power Analysis is a must. It ensures reproducibility by helping you avoid p-hacking and being fooled by false positives.
NOTE: This StatQuest assumes that you are already familiar with the concept of Statistical Power, Population Parameters vs Estimated Parameters and p-hacking. If not, check out the 'Quests:
For a complete index of all the StatQuest videos, check out:
If you'd like to support StatQuest, please consider...
Support StatQuest by buying The StatQuest Illustrated Guide to Machine Learning!!!
...or...
...a cool StatQuest t-shirt or sweatshirt:
...buying one or two of my songs (or go large and get a whole album!)
...or just donating to StatQuest!
Lastly, if you want to keep up with me as I research and create new StatQuests, follow me on twitter:
0:00 Awesome song and introduction
0:42 Why we do a power analysis
2:40 Power analysis defined
3:14 Two factors that affect Power
4:06 How sample size affects Power
11:48 How to do a power analysis
15:10 Review of concepts
#statquest #statistics
 0:16:45
Power Analysis, Clearly Explained!!!
 0:08:19
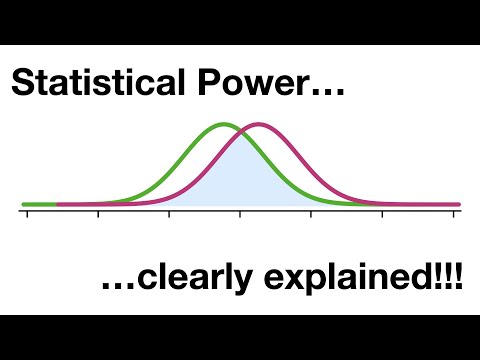
Statistical Power, Clearly Explained!!!
 0:03:39
How to calculate Sample Size using Power Analysis to answer your reviewers 👨🏻🔬 #Power #analysis...
 0:26:55
Power Analysis
 0:04:42
G*Power Sample Size Calculations: 5 Min Demo
 0:09:45
Introduction to power in significance tests | AP Statistics | Khan Academy
 0:10:36
How To Calculate Sample Size Using Power Analysis
 0:39:03
How to perform a power analysis
 1:30:43
The Power of Song: Repercussions for Freedom of Expression and Digital Rights in Hong Kong
 0:11:04
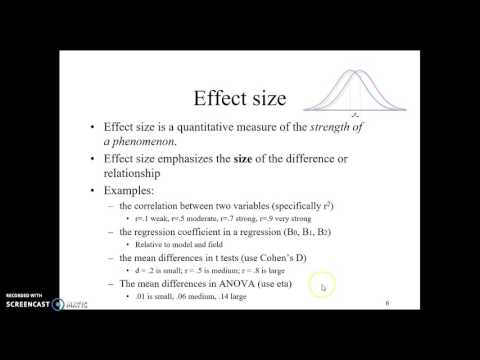
Power & Effect Size
 0:11:22
Calculating Sample Size with Power Analysis
 0:07:16
Statistical POWER and Power Analysis
 0:06:33
Sample Size and Effective Sample Size, Clearly Explained!!!
 0:21:36
AB Testing 101 | Fmr. Google Data Scientist Explains How to Calculate the Sample Size
 0:00:42
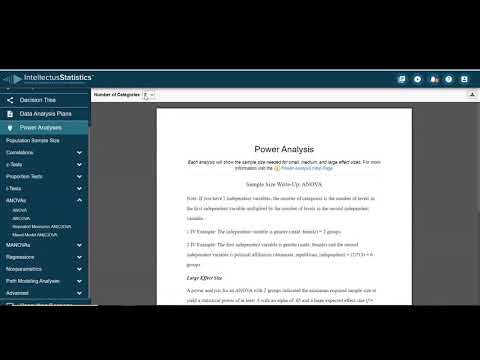
Power Analysis
 0:00:56
Explain Statistical Power in Data Science Interviews
 0:11:21
p-values: What they are and how to interpret them
 0:07:38
Sample Size Estimation in A/B Testing: Easy Explanation for Data Science Interviews
 0:10:17
How to do a power analysis
 0:02:44
G*Power: Calculating Sample Size in a T-Test
 0:15:27
HYPOTHESIS TESTING BASICS: Type 1/Type 2 errors | Statistical power
 0:07:41
What Is A P-Value? - Clearly Explained
 0:04:16
G*Power: Calculating Achieved Power for T-Tests
 0:05:48
Standardization vs Normalization Clearly Explained!
Комментарии