filmov
tv
Difference between Attribute Control Chart (p, np, c, u) / IATF 16949 | HINDI | Bhavya Mangla

Показать описание
In this video, you will understand the key difference between the different Attribute Control Chart (p, np, c, u).
In the statistical studies, Walter Shewhart and W Edward Deming have done tremendous work to understand the variation in the process and its causes through statistical studies. The understanding of these variations is important to improve quality, increase productivity and reduce cost (QCD).
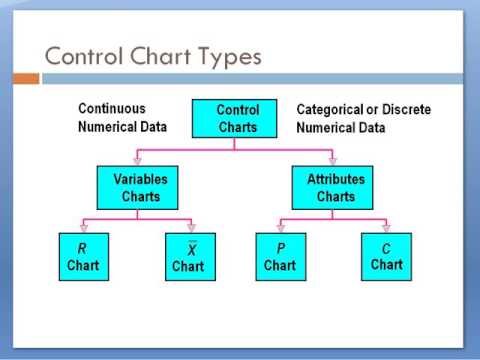
There are different types of attribute control charts that are plotted based on the type of data and criticality of the problem (p, np, c, u). By understanding these charts and taking suitable actions, the process can be brought under statistical control.
- p, np: Number of defective items
- c, u: Number of defects/unit
#spc
#attribute control charts
#variable control charts
 0:18:41
Attribute Data Control Chart Examples!! How to select/create the P, NP, C and U Charts
 0:07:51
Control Charts Variable vs Attribute
 0:03:22
p chart vs np chart vs c chart vs u chart / 8 Differences between attribute control chart
 0:02:00
HOW TO SELECT CONTROL CHART FOR ANY DATA / VARIABLE CHART / ATTRIBUTE CHART / USE OF CONTROL CHART
 0:05:20
Difference between Attribute Control Chart (p, np, c, u) / IATF 16949 | ENGLISH | Bhavya Mangla
 0:06:23
1.8.4 Attribute Control Charts
 0:07:58
Difference between Variable and Attribute Control Chart / IATF 16949 | HINDI | Bhavya Mangla
 0:08:45
SPC control charts | Control charts for variables | Control charts for attributes
 0:07:17
Difference between Variable and Attribute Control Chart / IATF 16949 | ENGLISH | Bhavya Mangla
 0:14:04
QC101 Attribute Control Charts P & NP Charts
 0:05:17
P Chart - Attribute control chart
 0:26:44
Control Charts For Variables
 0:04:20
Attribute Control Chart by Nova Silva
 0:16:21
attribute control charts
 0:12:16
CONTROL CHART BASICS and the X-BAR AND R CHART +++++ EXAMPLE
 0:06:27
Difference between Attribute Control Chart (p, np, c, u) / IATF 16949 | HINDI | Bhavya Mangla
 0:09:20
VA Quality Scholars: Attribute Data Statistical Process Control - C and U Charts
 0:04:47
Difference between Attribute Inspection and Variable Inspection With Simple Example.
 0:07:19
Topic 10 - 06. Statistical Process Control: Attribute Control Charts
 0:51:48
Control Charts for Attributes Part 1
 0:23:38
Variables Control Charts
 0:09:11
Attribute Control Charts Example 1 Multiple Choice Questions
 0:41:52
Chapter 7
 0:15:14
Create a Basic Control Chart | HOW TO CREATE CONTROL CHARTS IN EXCEL | Shewhart Control Chart
Комментарии