filmov
tv
Evening Doji Star: Key Bearish Reversal Candlestick Pattern #trading#traders #stockmarket #nifty

Показать описание
Evening Doji Star: Key Bearish Reversal Candlestick Pattern #trading#traders #stockmarket #nifty
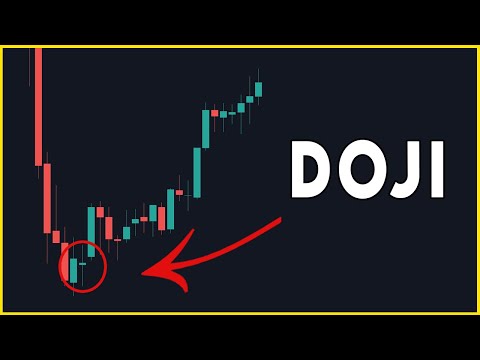
The Evening Doji Star candlestick pattern is a significant bearish reversal signal commonly seen in financial markets. It typically appears at the end of an uptrend, indicating a potential shift in market sentiment from bullish to bearish. The presence of a doji in the pattern underscores market indecision, which is then resolved in favor of the bears.
Components of the Evening Doji Star Pattern:
First Candle: A long bullish (green or white) candlestick that reflects the prevailing uptrend and strong buying pressure.
Second Candle: A doji candlestick (where the opening and closing prices are virtually the same), which gaps up from the first candle. This doji signifies indecision and a potential pause in the uptrend.
Third Candle: A long bearish (red or black) candlestick that opens below the body of the doji and closes well into the body of the first candle, confirming the reversal in market sentiment.
Interpretation:
The Evening Doji Star pattern suggests that the buying pressure is weakening and sellers are beginning to take control. The formation of the doji indicates a moment of indecision, and the long bearish third candle confirms the shift in sentiment, signaling the start of a potential downtrend.
Trading Strategy:
Entry Point: Traders often enter short positions at the close of the third bearish candle or the opening of the next candle, anticipating further downward movement.
Stop Loss: A stop-loss order can be placed above the high of the doji to manage risk.
Target: The initial target can be set based on the nearest support level or a predefined risk-to-reward ratio.
Example:
Understanding the Evening Doji Star candlestick pattern can help traders identify potential trend reversals and capitalize on downward price movements. This pattern is a valuable tool for technical analysts looking to make informed trading decisions based on shifts in market sentiment.
 0:00:10
 0:00:10
 0:00:47
 0:00:58
 0:01:58
 0:00:19
 0:01:50
 0:00:23
 0:01:38
 0:00:19
 0:10:53
 0:00:48
 0:07:49
 0:13:48
 0:08:57
 0:00:55
 0:18:00
 0:11:45
 0:03:49
 0:03:45
 0:05:40
 0:00:42
 0:16:33
 0:00:30