filmov
tv
Automate Excel Pivot Table With Python
Показать описание
Excel being the most popular spreadsheet application + Python being one of the most popular programming language, by integrating these two applications, we can build some really useful and sophisticate applications.
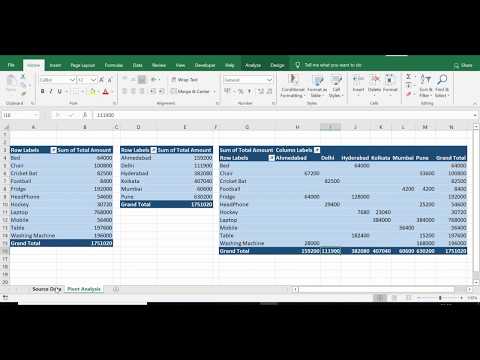
In this tutorial, we will learn how to automate Excel pivot table with Python using pywin32 (win32com) library.
▶ References
► Buy Me a Coffee? Your support is much appreciated!
-------------------------------------------------------------------------------------------
☕ Venmo: @Jie-Jenn
► Support my channel so I can continue making free contents
---------------------------------------------------------------------------------------------------------------
#excel #python #ExcelAutomation
 0:24:03
Automate Excel Pivot Table With Python
 0:25:17
Automate Excel Pivot Table with VBA | Create A Pivot Table | Lesson 1
 0:04:26
Refresh All Pivot Tables Automatically When Source Data Change - Excel VBA
 0:06:37
I don't use PIVOT tables anymore... I use this other thing instead!
 0:17:11
Automate daily reporting in Excel using Pivot Tables
 0:08:07
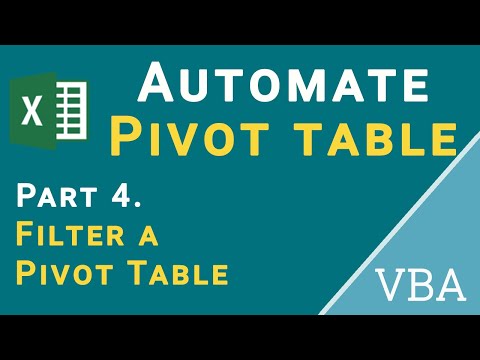
Automate Excel Pivot Table with VBA | Filter a Pivot Table | Lesson 4
 0:05:40
3.3. Automatic and manual sorting | Excel pivot tables COURSE
 0:08:57
Simple pivot table using an excel macro
 0:58:59
Live Masterclass: Advance Excel 2024 [Under 40 minutes] | Coding Ninjas
 0:11:30
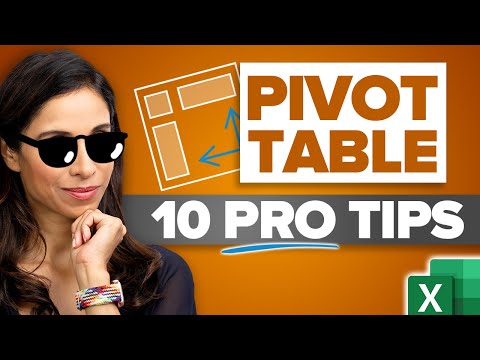
You Won't Believe These Crazy PIVOT TABLE Hacks!
 0:17:47
PivotTable Tricks That Will Change the Way You Excel (Free File)
 0:09:37
Auto Refresh PivotTables & Queries - without VBA!
 0:04:37
Automate Excel Pivot Table with VBA | Delete Pivot Tables | Lesson 3
 0:05:26
Automate Excel Pivot Tables Across Workbooks - Learn Python Pandas
 0:14:48
Introduction to Pivot Tables, Charts, and Dashboards in Excel (Part 1)
 0:13:36
Pivot Table Excel Tutorial
 0:08:03
Excel - Pivot Table Automation with VBA
 0:12:35
Make Pivot Table from Multiple Sheets in Excel
 0:11:15
Automate pivot Excel tables in different sheets and rename the pivot sheet - Power Automate Desktop
 0:16:18
Automate Pivot Tables and Charts with Python | Excel Automation Hacks
 0:08:48
Easy Excel PivotTable Profit & Loss Statements
 0:02:55
Automate Pivot Table Creation
 0:20:49
How to Create Pivot Table in Excel
 0:04:19
Amazing Automation with ChatGPT: Create Excel Pivot Tables and Send Multiple Emails in Seconds
Комментарии