filmov
tv
Introduction to Data Visualization in R: Part 1

Показать описание
In this video, the R For Fun Club (RFC) provides a comprehensive, beginner-friendly introduction to R programming tailored specifically for health researchers. Join us as our facilitators guide you through;
* Principles of effective data visualization
* Building blocks of ggplot
* Type of visualization
RFC is your go-to club for learning R Programming, It is tailored for clinical health researchers, public health professionals, bioinformaticians, and students in health-related fields. Whether you are a final-year bachelor’s student or a postgraduate, our peer-to-peer support system ensures you gain essential data analysis skills. All levels are welcome!
Afredac Ubuntu Platform is a pan-African peer-to-peer network to enhance health research and data science in Africa. It's a free platform where health and data researchers working on African projects connect in training, exchange experience, develop innovations, and advance discovery in Africa.
 0:11:02
Data Visualization in 2024 | The Ultimate Guide
 0:27:21
Data Visualization Tutorial For Beginners | Big Data Analytics Tutorial | Simplilearn
 0:06:54
Introduction to data visualization (Michele Mauri)
 0:01:44
What Is Data Visualization?
 0:00:10
Data Visualization #short
 1:01:06
Intro to Data Visualization Session 1
 0:10:08
Introduction to Data | Data Visualization | GeeksforGeeks School
 1:03:38
Introduction to Data Visualization
 5:26:32
R programming data visualization with ggplot2 part 74
 0:10:55
Data Visualization – An Introduction
 0:22:01
Intro to Data Analysis / Visualization with Python, Matplotlib and Pandas | Matplotlib Tutorial
 0:08:16
I started my data analyst career taking these beginner courses
 0:09:04
What Is Data Analytics? - An Introduction (Full Guide)
 0:05:21
Data Visualization ll Data Analytics ll Objectives Of Data Visualization Explained in Hindi
 1:25:03
Introduction to Data Visualization workshop
 1:54:06
Introduction to Data Visualization
 0:02:26
What is Data Analytics and Visualization?
 0:11:52
Data Visualization Tutorial - Overview of data visualization in Processing
 0:03:50
What is Data Visualization | Introduction to Data Visualization | Data Visualization Tutorial
 0:16:54
Intro to Data Visualization in Python with Chartify
 0:04:34
Python Tutorial: Introduction to data visualization with Matplotlib
 0:09:01
Tutorial 1- What is Data Visualization and Its Importance?
 0:00:31
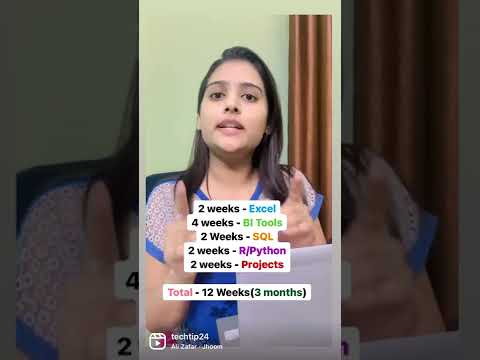
Data Analytics 3 months roadmap #dataanalytics #datascience #upgradeskill #livetraining
 0:14:25
Descriptive statistics and data visualisation. An introduction to statistics and working with data
Комментарии