filmov
tv
Nephroid epicycloid animation code in description smaller circle rolling on larger circle #shorts

Показать описание
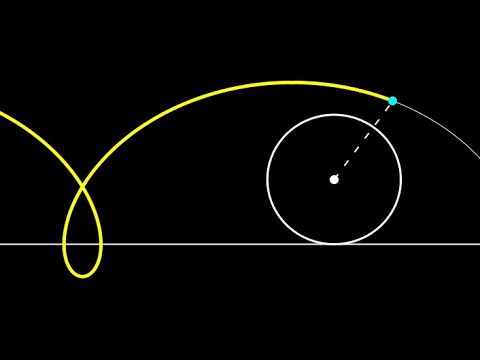
Nephroid epicycloid animation code in description smaller circle rolling on larger circle.
A smaller circle rolling on a larger circle with twice the radius traces a two pointed epicycloid curve called a nephroid. Every two revolutions of the smaller circle complete the curve, forming the nephroid epicycloid curve with two cusps. We roll the smaller circle around the larger circle and the trace point from the smaller circle builds the nephroid curve. Code for the animation is included for wxMaxima, but it can be used as pseudocode for any similar system.
Animation smaller circle rolling on a larger circle forming a two cusped epicycloid (nephroid): code for the animation:
/*animation with all guidelines*/
kill(all)$
rlist:makelist(i,i,0,399)$
wxanimate_framerate:15$
wxplot_size:[1000,1000]$
with_slider_draw(
r,rlist,
ytics=false,
xtics=false,
nticks=1000,
color=black,
line_width=2,
xrange=[-6.8,6.8],
yrange=[-6.8,6.8],
/*inner circle*/
color=black,
line_width=2,
parametric(3*cos(t),3*sin(t),t,0,2*%pi),
/*outer circle*/
parametric(1.5*cos(t)+4.5*cos(2*%pi/200*r),1.5*sin(t)+4.5*sin(2*%pi/200*r),t,0,2*%pi),
/*center of the rolling circle and center of the inner circle*/
point_type=7,
point_size=2,
points([[4.5*cos(2*%pi/200*r),4.5*sin(2*%pi/200*r)]]),
points([[0,0]]),
/*line from center of large circle to center of small circle*/
line_type=dashes,
parametric(t*4.5*cos(2*%pi/200*r),t*4.5*sin(2*%pi/200*r),t,0,1),
/*parametric line from center of small circle to trace point*/
/*set up parametric equation from center point to trace point using 1-t,t idea*/
color=black,
line_type=dashes,
parametric(4.5*cos(2*%pi/200*r)*(1-t)+t*(4.5*cos(2*%pi/200*r)-1.5*cos(3*2*%pi/200*r)),4.5*sin(2*%pi/200*r)*(1-t)+t*(4.5*sin(2*%pi/200*r)-1.5*sin(3*2*%pi/200*r)),t,0,1),
/*nephroid trace*/
line_type=solid,
line_width=4,
color=blue,
parametric(4.5*cos(t)-1.5*cos(3*t),4.5*sin(t)-1.5*sin(3*t),t,0,2*%pi/200*r),
/*point at the leading edge of the trace*/
color=red,
points([[4.5*cos(2*%pi/200*r)-1.5*cos(3*2*%pi/200*r),4.5*sin(2*%pi/200*r)-1.5*sin(3*2*%pi/200*r)]])
);
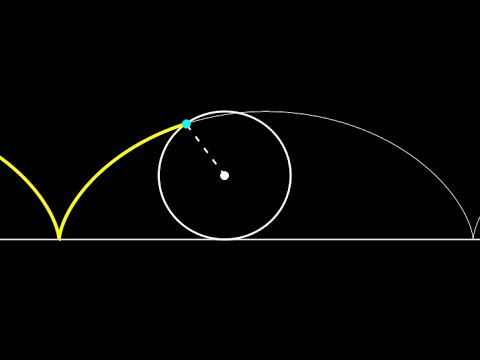
 0:00:26
 0:00:31
 0:00:30
 0:00:46
 0:00:31
 0:00:41
 0:00:32
 0:00:26
 0:00:37
 0:00:16
 0:00:12
 0:00:36
 0:00:37
 0:00:16
 0:00:20
 0:00:08
 0:00:39
 0:00:09
 0:00:49
 0:00:37
 0:00:04
 0:00:12
 0:00:40
 0:03:37