filmov
tv
Financial Time Series Analysis using Wavelets

Показать описание
1. QX Data Science Event | 10.05.2019 | QX Manor in Frankfurt am Main
Description:
Presentation by Markus Vogl at the 1. QX Data Science Event about Financial Time Series Analysis using Wavelets.
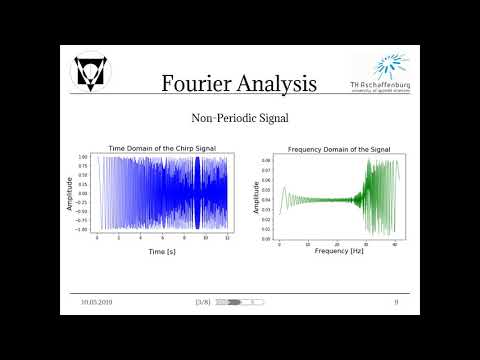
Contains Explanations of Financial Time Series Properties (e.g. Markov, Martingale, Stationarity & Gaussianity versus Fractality & Momentum), Signal Theory (e.g. Fourier Analysis, Short Time Fourier Analysis & Continuous as well as Discrete Wavelet Transformations).
Concludes with outlook into research on Wavelet Neural Networks, Fractals & Chaos Theory.
Partners, Event-Team & Presentor:
#lecture #university #timeseriesanalysis #timeseries #statistics #python #pythonprogramming #pythontutorial #data #datascientist #finance #stockmarket #quantitativefinance #marketanalysis #wavelet #signal #signalanalysis #fourier_series #fouriertransform #wavelengths #waveletneuralnetwork #WNN #wnn
Description:
Presentation by Markus Vogl at the 1. QX Data Science Event about Financial Time Series Analysis using Wavelets.
Contains Explanations of Financial Time Series Properties (e.g. Markov, Martingale, Stationarity & Gaussianity versus Fractality & Momentum), Signal Theory (e.g. Fourier Analysis, Short Time Fourier Analysis & Continuous as well as Discrete Wavelet Transformations).
Concludes with outlook into research on Wavelet Neural Networks, Fractals & Chaos Theory.
Partners, Event-Team & Presentor:
#lecture #university #timeseriesanalysis #timeseries #statistics #python #pythonprogramming #pythontutorial #data #datascientist #finance #stockmarket #quantitativefinance #marketanalysis #wavelet #signal #signalanalysis #fourier_series #fouriertransform #wavelengths #waveletneuralnetwork #WNN #wnn
 0:07:29
What is Time Series Analysis?
 0:04:01
Course Syllabus | Financial Time Series Analysis | Quantra Course
 0:03:00
Introducing Time Series Analysis and forecasting
 0:31:38
Financial Time Series Analysis using Wavelets
 0:05:03
How to Trade Using Time Series | Financial Time Series Analysis for Trading | Quantra Course
 0:01:21
Financial Analysis with Time Series Visualization
 0:14:19
Financial Time Series Analysis using Wavelets & Neural Networks
 0:23:09
Time Series Forecasting with XGBoost - Use python and machine learning to predict energy consumption
 0:50:38
Market on Close - June 27, 2025
 0:20:42
Forecasting with the FB Prophet Model
 1:16:19
8. Time Series Analysis I
 0:05:10
What are ARCH & GARCH Models
 0:11:09
Time Series Vs Non Time Series Problems- Why Time Series Forecasting Is Difficult?
 0:07:10
Time Series Talk : Moving Average Model
 0:10:02
Time Series Talk : Stationarity
 0:15:02
How to Encode Financial Market Data for Machine Learning Time Series
 0:09:17
Forecasting Financial Time Series using Attention based Models
 0:12:16
Detrending and deseasonalizing data with fourier series
 0:35:29
Dr Egor Kraev - Easy Bayesian regularization for fitting financial time series and curves
 0:09:35
Forecasting in Excel: MUST-KNOW for Any Analyst
 0:10:20
11 Stylized Facts of Financial Time Series
 0:31:36
Financial Data Forecaster Time Series Forecasting on Stock Prices and Index
 0:03:34
What is Time Series Data | Python for Trading | Quantra Free Course
 0:18:50
Time Series Analysis SIMPLE Exam Technique | ACCA PM / F5 | Question Sauce
Комментарии