filmov
tv
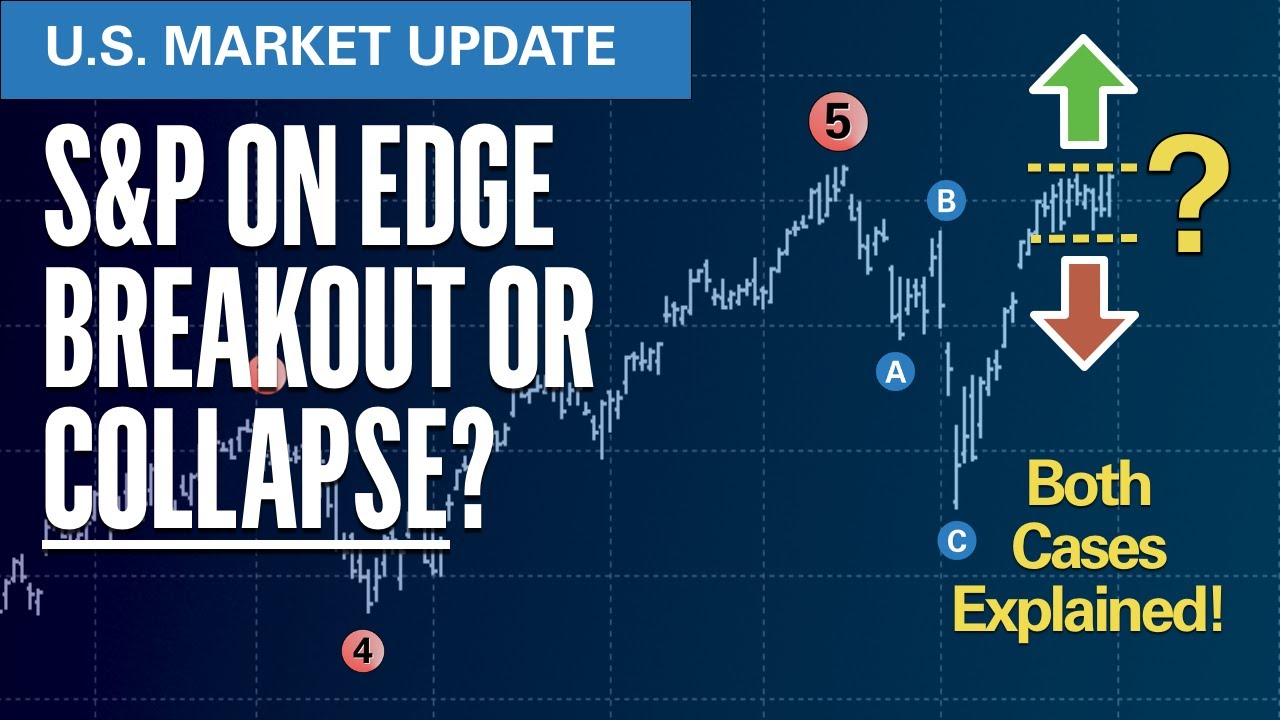
S&P on EDGE! Breakout or Collapse? Both Cases Explained | Elliott Wave S&P500 VIX Technical Analysis
Показать описание
This week, Rob's Elliott Wave analysis for stock, crypto, and option traders covers key market movements, focusing on the S&P 500, Dow Jones, NASDAQ, and key sectors like tech and small-cap stocks. He starts by examining the potential impact of upcoming rate cuts indicated by the Federal Reserve and evaluates how the S&P 500 is positioned near critical resistance levels. Rob discusses the Dow's recent breakout above its July highs and how it differs from the S&P 500's pattern. In the NASDAQ, he explores the possibility of a bearish zigzag formation developing. Rob also reviews signals in the Russell 1000 Value ETF, signaling market rotation. He concludes with insights into Bitcoin, Ethereum, and key stocks like Nvidia and Tesla, focusing on potential breakout scenarios and the broader macroeconomic environment.
:: How to Subscribe to TRADEFINDER LIVE! for Free ::
------------------------------------------------------------------------------------
Become a FREE Tradefinder Member using the link below.
As a subscriber you’ll watch live as Rob finds new trading opportunities each week.
:: Subscribe to the HUBB Channel for Live Updates and Q&A ::
---------------------------------------------------------------------------------------------------
To participate in Q&A with Rob Roy, join us at the HUBB YouTube channel. Click the link below now to subscribe for free.
:: Sections in this Video ::
------------------------------------------------------------------------------------
00:00 - Introduction
00:45 - Economic News
02:28 - SPY
04:10 - DIA
06:05 - IWD
07:15 - QQQ
08:56 - TNX
12:40 - US Dollar
13:23 - TLT
13:57 - VIX
14:39 - Bitcoin
15:38 - Ethereum
16:15 - USO
17:18 - NVDA
20:46 - GLD
21:49 - SLV
23:10 - TSLA
24:30 - SMCI
:: To receive TRADE ALERTS for our strategies see links below ::
------------------------------------------------------------------------------------------------
:: Other Links to Follow Us::
--------------------------------------------
In this week’s video, Rob Roy provides an extensive Elliott Wave analysis of major markets and specific sectors, focusing on how current economic indicators and Federal Reserve policies are influencing market behavior. He begins by discussing recent economic news, including Fed Chair Jerome Powell's comments suggesting a shift towards rate cuts. Rob outlines how the potential 25 basis point rate cut in September might affect different asset classes.
Next, Rob shifts to the Dow Jones (DIA), highlighting its breakout above July highs and discussing the implications of this divergence from the S&P 500. He explains how the Dow's breakout is backed by strong directional movement indicators, unlike the S&P 500, which lacks momentum despite recent gains.
On the NASDAQ (QQQ), Rob identifies a potential bearish zigzag pattern and emphasizes the importance of the 50-day moving average in determining the next move. If the index breaks below this key level, it could signal the continuation of a downward wave.
In the sector analysis, Rob highlights a new signal in the Russell 1000 Value ETF (IWD), indicating a market rotation from growth to value stocks. He sees this as a sign of broader market trends where different sectors and styles are beginning to participate after a period dominated by the "MAG 7" tech giants. Moving to the bond market, Rob analyzes the symmetrical triangle pattern forming in the 10-year Treasury yield (TNX), which could signal a significant move in either direction depending on upcoming economic data.
Rob also dives into cryptocurrency, discussing the symmetrical triangles forming in both Bitcoin and Ethereum. He provides insights into potential breakout scenarios for both digital assets and emphasizes the importance of the $60,000 level for Bitcoin. He also reviews stocks like Nvidia (NVDA), Tesla (TSLA), and SMCI, focusing on earnings results, technical patterns, and potential trading strategies.
Finally, Rob touches on precious metals, analyzing patterns in gold (GLD) and silver (SLV). He points out the multiple triangles in gold's chart and the potential implications for traders. Overall, this week's video provides a detailed breakdown of major markets, integrating Elliott Wave theory with macroeconomic factors to guide traders in making informed decisions.
 0:26:54
S&P on EDGE! Breakout or Collapse? Both Cases Explained | Elliott Wave S&P500 VIX Technical ...
 0:03:46
How to Spot a Breakout?
 0:55:36
How to improve your processes with Solid Edge SP (Breakout session SEU14)
 0:37:13
Managing Projects and ECOs in Solid Edge SP (Breakout session SEU14)
 0:10:49
8 Must-Have Players | High-Upside Fantasy Football Draft Picks
 0:07:07
We got the breakout, what's next?
 0:13:08
Your Weekly Edge: Anatomy Of A Base Breakout | Simpler Trading
 0:40:08
🔥🔥 This *FAKE-OUT BREAKOUT* Could Easily 15X on Tuesday! 💰
 0:21:07
S&P 500 Falters Before It Can Notch a Breakout, What History Says of Trends from Here
 0:47:33
Breakout Scalping Forex In 2022 | Trading Spotlight
 0:12:06
How To Profitably Day Trade $SPY Options (CHEATSHEET)
 0:18:15
Breakout or Consolidation? Technical Analysis!
 0:04:42
Jugar con TECLADO y RATÓN cualquier Juego Android Conecta por cable SIN LAG
 0:41:12
🔥🔥 This *FAKE-OUT BREAKOUT* Could Easily 10x Ahead of Powell on Tuesday!
 0:42:09
Why The Bulls Have An Edge Over The Bears
 0:46:44
Simplify Your Design World With Solid Edge SharePoint (Breakout session SEU14)
 0:37:37
🔥🔥 REVERSAL ALERT! This FAILED BREAKOUT Could Be an Easy 10x on Tuesday!!
 0:00:16
When SKILL finds you || Pavlov
 0:00:48
ON Semiconductor pulling back to the breakout. #shorts
 0:29:35
Stock Market Running Into Resistance! Breakout, Consolidate, Or Pullback?
 0:12:54
The 9 EMA Is A Scalping CHEAT CODE
 0:10:29
In 3D Cinema, He Accidentally Uses 2D Glasses & Discovers Shocking Truth
 0:21:17
S&P 500 at a Record High and Dollar Awaits Breakout with Fed Decision Ahead
 0:07:55
Test Drive | Corning's FOBOT (Fibre Optic Breakout Tray)
Комментарии