filmov
tv
Graphing a linear equation in slope intercept form

Показать описание
👉 Learn how to graph linear equations written in slope intercept form. When given a linear equation in slope intercept form, (i.e. in the form y = mx + c, where m is the slope and c is the y-intercept). We first plot the y-intercept and using the slope, we can determine the rise and the run of the required line and then be able to plot the next point from the y-intercept. We then draw a straight line passing through the two plotted points.
Organized Videos:
✅Graph Linear Equations
✅Graph Linear Equations | Learn About
✅Graph Linear Equations From a Table
✅Graph Linear Equations in Standard Form | Fractions
✅Graph Linear Equations in Standard Form
✅Graph Linear Equations in Slope Intercept Form
✅Graph Vertical and Horizontal Lines
✅Graph Linear Equations Using Slope and Y-intercept
Connect with me:
#linearequations #linearequations #brianmclogan
 0:04:53
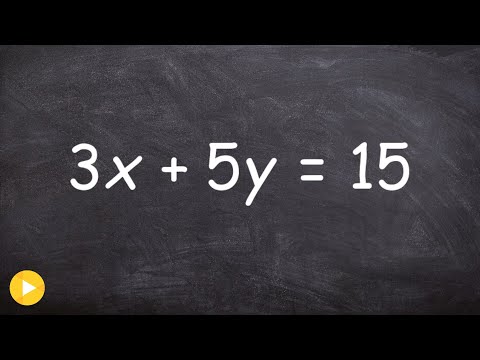
Graphing a linear equation by rewriting from standard form to slope intercept form
 0:13:10
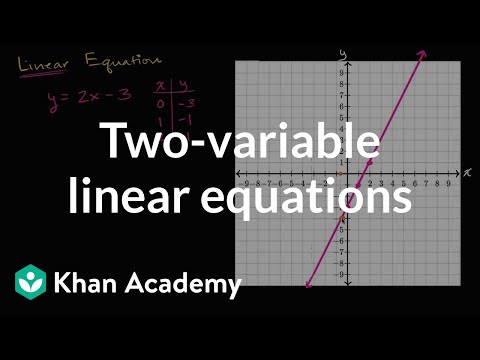
Graphs of linear equations | Linear equations and functions | 8th grade | Khan Academy
 0:05:15
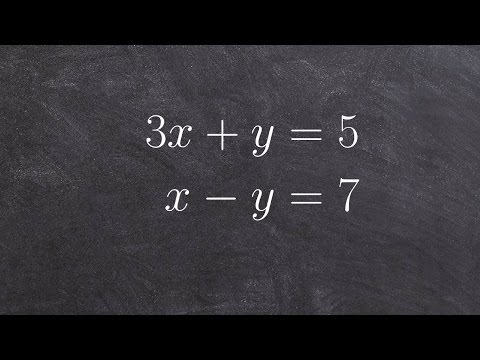
Solving Systems of Equations By Graphing
 0:32:05
Linear Equations - Algebra
 0:05:22
Solving a linear system of two equations by graphing
 0:05:57
Drawing Linear Graphs
 0:06:56
Graphing in Algebra: Ordered Pairs and the Coordinate Plane
 0:08:20
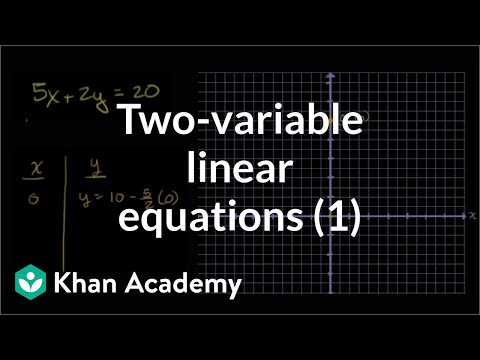
Two-variable linear equations and their graphs | Algebra I | Khan Academy
 0:20:18
Universal Mathematics Book |Chapter-15 | Introduction to Graphs| Class 8 | Innings 15.1 | P-2
 0:10:14
Algebra Basics: Graphing On The Coordinate Plane - Math Antics
 0:03:46
How to Graph Lines in Slope Intercept Form (y=mx+b)
 0:13:24
Basic Linear Functions - Math Antics
 0:10:05
How To Find The Equation of a Line From a Graph | Algebra
 0:03:33
Ex 1: Graph a Linear Equation Using a Table of Values
 0:10:47
Solving System of Linear Equations by Graphing - Math Teacher Gon
 0:03:15
Graph a linear equation by the x and y intercepts
 0:04:47
Learn how to solve a system of equations by graphing
 0:04:53
GCSE Maths - What on Earth is y = mx + c #67
 0:10:34
LINEAR INEQUALITIES GRAPHING EXPLAINED!
 0:00:46
How to draw graph of the Linear Equation y=2x+3 #math #tutor #mathtrick #learning #shorts #graph
 0:05:33
Learn to graph a line in slope intercept form
 0:02:29
Graphing a linear equation in slope intercept form
 0:04:29
Graphing solutions to two-variable linear equations example 1 | Algebra I | Khan Academy
 0:03:58
How To Graph Linear Equations In Point Slope Form | Algebra
Комментарии