filmov
tv
Data Transformations and GIS Analysis Practical Example

Показать описание
In this tutorial, you will learn how to make use of Pandas library of python programming language to transform a dataset using various data wrangling and manipulation techniques, and then use that dataset in QGIS for performing geospatial analysis.
In this example, we download a dataset from the UK police database, which shows crime incidents recorded in the city of London. Usually the freshly downloaded data in its raw format are not in a suitable structure to be used for analyses, hence will require undergoing a number of intermediary data transformation steps.
Finally, we import the cleaned dataset into QGIS using latitude and longitude information provided, to visualize the spatial locations of the crime incidents. Furthermore, by way of employing a categorical symbology type, we also visualize the crime incidents by type, which can provide a much clearer outlook of the data. We also create a heatmap based on the density of the points, which allows us to clearly visualize where the crime hotspots are located at. We use QGIS for performing all of the spatial visualization tasks, including the creation of the spatial heatmaps for identifying crime hotspots.
#dataanalysis #spatialdata #geodeltalabs
 0:43:09
Data Transformations and GIS Analysis Practical Example
 0:01:03
The Power of Geospatial Data Analytics – Dassault Systèmes
 0:15:12
FASTEST Way to Learn Modern GIS and ACTUALLY Get a Job
 0:26:01
GIS analysis-1
 0:18:31
Esri 2018 Petroleum GIS Conference: Enable Digital Transformation with Big Spatial Data & Analyt...
![[Part 2] Transforming](https://i.ytimg.com/vi/3GxM-AOanAo/hqdefault.jpg) 0:01:00
0:01:00
[Part 2] Transforming GIS Data into Functional Road Models for Large-Scale Traffic Simulation
 0:24:46
How I Would Learn GIS (If I Had To Start Over)
 0:05:58
Analyzing Geospatial Data with BigQuery GIS
 0:03:33
What is Data Integration and How Does It Work?
 0:00:20
1st yr. Vs Final yr. MBBS student 🔥🤯#shorts #neet
 0:10:34
What is Data Pipeline | How to design Data Pipeline ? - ETL vs Data pipeline (2024)
 0:02:57
ArcGIS Urban - Transforming Urban Planning and Design
 1:06:41
How to Transform Data between AutoCAD and GIS
 0:28:24
ChatGPT in Remote Sensing and GIS
 0:01:09
How to Convert GeoJSON to CSV: Step-by-Step Guide | Online GIS Data Converter | Transform gis data
 0:54:16
GIS, Spatial Analysis, and Statistics
 0:30:37
Lecture 20 : GIS Analysis-01
 0:00:12
MAPOG: Transforming the world with mapping solutions! | MAP STORY #map #gis #solution #fun #mapping
 0:00:18
🌍 ✅Geospatial Data EXPLAINED by GIS Expert #data #maps #shorts
 0:13:11
Tutorial 22-Univariate, Bivariate and Multivariate Analysis- Part1 (EDA)-Data Science
 0:42:59
GIS analysis - Part 2 (Overlaying Operations)
 0:03:47
A brief introduction to GIS Data: raster and vector
 0:00:16
Testing Stable Diffusion inpainting on video footage #shorts
 0:10:01
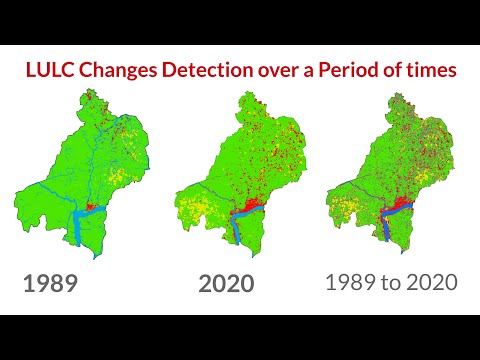
Land use/Land cover Change detection Analysis for an Area over a certain timeline like 1989 to 2020
Комментарии