filmov
tv
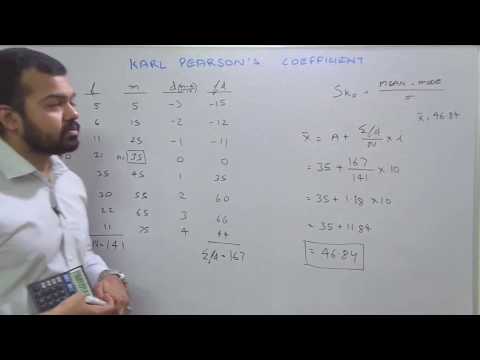
Karl Pearson's coefficient of Skewness | Learn Economics on Ecoholics

Показать описание
Do you know how to calculate quartile deviation when the data is in individual series? This video teaches you how to calculate the quartile deviation when the data provided is in discrete form or individual series. Our expert faculty teach the formula, Mr Sanat Srivastava, step-by-step, making it easier for you to understand and grasp. Visit our website and download our app to avail yourself of video lectures and the study material.
Ecoholics is the largest platform for economics.
If you’re preparing for competitive exams like UPSC IES, RBI DPER or UGC NET then Ecoholics is the one-stop destination for all your learning needs. Study economics the smart way and get an in-depth understanding of this dynamic subject with our holistic approach. Our team of expert faculties help you polish your knowledge and provides you with one-on-one mentorship and doubt-clearing sessions, so you leave no stone unturned when it comes to your preparation. By signing up with us, you can access our live classes, video lectures, test series and get the hard copy of study material delivered to your doorstep, so your preparation never hits a bump!
Follow our social media handles to stay updated on all things economics.
#economics #economic #economists #upsc #rbi #indianeconomicsservice #ias #iitjam #gateeconomics #ugcnet #ugc #jrf #economy #unionpublicservicecomission #ignou #dse #jnu #maentrance #pgentrance #karlpearson #numericals #Ies
 0:09:10
BCA | Statistics | Skewness | Karl Pearson's and Bowley's co-efficient of Skewness.
 0:16:36
Karl Pearson's coefficient of Skewness | Learn Economics on Ecoholics
 0:05:10
𝐊𝐚𝐫𝐥 𝐏𝐞𝐚𝐫𝐬𝐨𝐧’𝐬 𝐂𝐨𝐞𝐟𝐟𝐢𝐜𝐢𝐞𝐧𝐭 𝐨𝐟 𝐒𝐤𝐞𝐰𝐧𝐞𝐬𝐬...
 0:20:33
Measure of skewness (karl Pearson's coefficient of skewness) B.Tech || Business Statistics || N...
 0:01:43
What Is The Pearson Coefficient Of Skewness - How To Determine If Data Is Normally Distributed
 0:12:03
karl Pearsons coefficient of skewness problems
 0:05:47
(BA254) PEARSON'S COEFFICIENT OF SKEWNESS
 0:14:22
46. Karl Pearson's Skewness - Actual Mean Method from Statistics subject
 0:00:16
Calculate Karl pearson skewness #math #groupdata #quartile #groupeddata #mathtrick #median
 0:05:52
#37, KARL PEARSON'S COEFFICIENT OF SKEWNESS
 0:05:40
Karl Pearson's Coefficient of Skewness | Statistics & Probability
 0:06:49
KARL PEARSON'S COFFICIENT OF SKEWNESS
 0:08:55
Statistics - Karl Pearsons coefficient of skewness
 0:14:40
Class 2 Karl Pearson’s coefficient of skewness | measures of skewness
 0:06:20
Statistics: Karl Pearson's Coefficient of correlation
 0:00:17
B. Statistics/ Pearson's 2nd Skewness Co-efficient
 0:00:40
Pearson's co-efficient of Skewness
 0:13:43
Karl Pearson's Coefficient of Skewness
 0:12:17
Coefficient of Skewness for Ungrouped Data using Karl Pearson's Method
 0:00:16
#economics karl Pearson's method
 0:04:38
karl pearson's coefficient of skewness
 1:01:39
Karl Pearson's Coefficient of skewness| Skewness and Kurtosis|StatisticsDream Maths
 0:03:10
Karl Pearson's Coefficient of Skewness 3
 0:04:18
Karl Pearson's Coefficient of Skewness.
Комментарии