filmov
tv
Sales Data Analysis With Python | Solving Real World Data Science Problems | Python Case Study | EDS

Показать описание
In this video we use Python Pandas & Python Matplotlib to analyze and answer business questions about 3 years worth of sales data. The data contains thousands of store purchases broken down by month, product type, cost, purchase address, etc.
Setup!
Detailed video description! (timeline can be found in comments)
We have answered these 5 questions through our data analysis mainly using pandas and matplotlib library.
Q1. What is the overall sales trend?
Q2. Which are the Top 10 products by sales?
Q3. Which are the Most Selling Products?
Q4. Which is the most preferred Ship Mode?
Q5. Which are the Most Profitable Category and Sub-Category?
To answer these questions we walk through many different pandas & matplotlib and seaborn library methods. They include:
- Adding columns
- Parsing cells as strings to make new columns (.str)
- Using the .apply() method
- Using groupby to perform aggregate analysis
- Plotting bar charts and lines graphs to visualize our results
If you enjoy this video, make sure to leave it a like and subscribe to not miss any future similar tutorials :).
Video Timeline!
0:00 - Intro
0:20 - Downloading the Data
1:30 - Opening Jupyter Notebok
2:05 - Objective
3:30 - Importing Libraries
4:23 - Importing Dataset
5:03 - Data Audit
11:10 - Q1. What is the overall sales trend?
16:35 - Q2. Which are the Top 10 products by sales?
20:22 - Q3. Which are the Most Selling Products?
23:40 - Q4. Which is the most preferred Ship Mode?
25:30 - Q5. Which are the Most Profitable Category and Sub-Category?
Thanks for watching! If you enjoyed, please consider subscribing :).
#EDScience #ExploreDataScience #datasciencecourse #DataScience #WhatIsDataScience #DataScienceForBeginners #DataScientist #DataScienceTutorial #DataScienceWithPython #DataScienceWithR #DataScienceCourse #BusinessAnalytics #MachineLearning#pythoncourse #pythontutorialforbeginners #pythonprojects #pythonmachinelearning #datascienceforbeginners #datasciencewithpython #datascienceclasses #datasciencebeginners #datasciencecourse #datasciencecareers #machinelearning
 0:28:57
Sales Data Analysis With Python | Solving Real World Data Science Problems | Python Case Study | EDS
 1:42:28
Explore Data Analysis in Python | Superstore Sales Analysis | Step-by-Step Guide
 0:08:25
Sales Data Analysis using Python
 0:28:26
Supermarket Sales Data Analysis Using Python Jupyter
 1:26:07
Solving real world data science tasks with Python Pandas!
 1:03:04
Stock Market Case Study: Analyzing Sales Data with Python [Tutorial] | Data Analysis with Python
 1:05:32
Sales Data Analysis with Python #DataScience #Python
 1:37:49
Super market sales data analysis in Python . End to End analysis using Python
 0:29:00
Data Reshaping Project - Brands Sales Data Analysis - Power BI and Python
 4:22:13
Data Analysis with Python - Full Course for Beginners (Numpy, Pandas, Matplotlib, Seaborn)
 0:00:29
Python in Excel‼️ #excel #python
 0:00:17
Data Analyst Projects Ideas for Portfolio | #dataanalytics #project #projectideas
 0:06:16
#11 Python Pandas Data Analysis Case Study on Sales SuperStore Data
 0:58:28
Ecommerce Case Study: Analyzing Sales Data with Python [Tutorial] Part 1 | Data Analysis with Python
 0:44:02
Python Project for Data Analysis- Exploratory Data Analysis | Data Analyst Project
 0:01:00
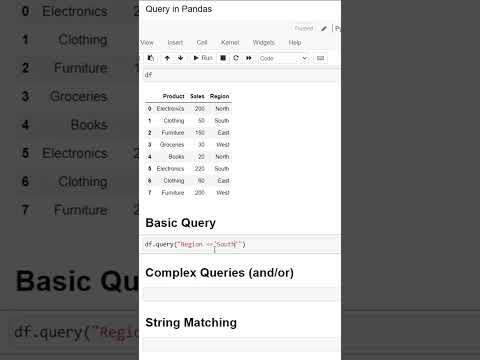
Python Data Query | Python for Data Analyst
 0:40:22
Exploratory Data Analysis with Pandas Python
 0:15:35
Marketing Sales Data Analytics Case Study using Python | Data Science
 0:19:01
Introducing Python in Excel
 0:13:40
Data Analysis for BEGINNERS in Excel in 2024 | No Python Required
 0:44:55
Economic Data Analysis Project with Python Pandas - Data scraping, cleaning and exploration!
 0:09:33
PROJECTS that landed Data Jobs for my Subscribers
 0:00:37
3 Python viz tips for Excel
 0:01:00
Missing Data? No Problem!
Комментарии