filmov
tv
Simple linear regression in STATA

Показать описание
Dependent, independent, exposure, explanatory, predictor, outcome, response variable, statistics, P value. mean, standard deviation, confidence, interval, normality test, homoscedastic, heteroscedasticity, equal variances, unequal variances, normal curve, statistical method, relationship, residuals, simple linear regression, regression line, slope, intercept, regression equation, trend line, correlation coefficient, R squared, r value, ANOVA, t test, , regression, prediction, data, continuous variable, fit regression line, regression model, assumptions, analyse, Descriptive, collinearity, histogram , normal probability plot , output, table, descriptive statistics, correlation coefficient, positive correlation significant, model summary , variances , significant , statistically significance value , graph , regression standardised residual, normally distributed , P-P plot, scattered plot, regression standardised residual standardised predicted value, Regression equation, trend line
Y=b0 +b1* X
Simple linear regression in STATA is one of the statistical technique or method used to examine the relationship between two variables one of the variable is the outcome or the response or the dependent variable and the other variable is the independent variable or the exposure or the explanatory variable or the predictor.
simple linear regression there is only one predictor and the test will fit the best regression line for the data and will generate align with an equation an from the equation which is called regression equation.
prediction can be calculated in STATA.
Two variables the systolic blood pressure which is an outcome an is a dependant variable and the age which is a predictor or an exposure both variables are continuous variables
assumptions have to be fulfilled before performing simple linear regression
the method how to perform the analysis in status will be described and an equation will be generated
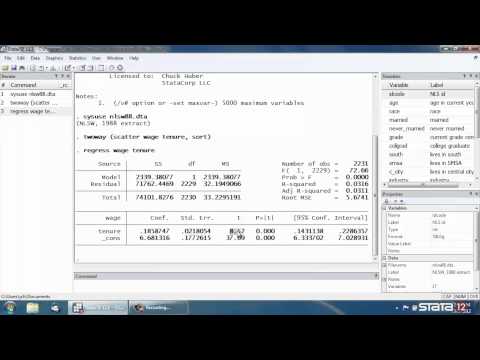
in the command section type regress for regression space then the outcome which is systolic blood pressure space then the age which is the predictor
table is generated showing that number of observations which is 100 the
P value for the test R-squared adjusted are squared P value is less than 0.05.
The test well examine whether slope equal to 0 or not
There is significant relationship between age and systolic blood pressure and systolic blood pressure can be predicted by the age.
R squared value is equal to .53 and this means that 53% of variation in the outcome which is a systolic blood pressure can be explained by the predictor which is the age
coefficient is 1.09 which means every one year increase in the age there is an increase of 1.1 value in the systolic blood pressure
The second value which is constant is 86.2 this is the intercept and there is a significant value here as the P value is less than 0.05 from
a regression equation can be generated as the following.
Y= intercept + slope* X
Y=b0 +b1* X
Simple linear regression in STATA is one of the statistical technique or method used to examine the relationship between two variables one of the variable is the outcome or the response or the dependent variable and the other variable is the independent variable or the exposure or the explanatory variable or the predictor.
simple linear regression there is only one predictor and the test will fit the best regression line for the data and will generate align with an equation an from the equation which is called regression equation.
prediction can be calculated in STATA.
Two variables the systolic blood pressure which is an outcome an is a dependant variable and the age which is a predictor or an exposure both variables are continuous variables
assumptions have to be fulfilled before performing simple linear regression
the method how to perform the analysis in status will be described and an equation will be generated
in the command section type regress for regression space then the outcome which is systolic blood pressure space then the age which is the predictor
table is generated showing that number of observations which is 100 the
P value for the test R-squared adjusted are squared P value is less than 0.05.
The test well examine whether slope equal to 0 or not
There is significant relationship between age and systolic blood pressure and systolic blood pressure can be predicted by the age.
R squared value is equal to .53 and this means that 53% of variation in the outcome which is a systolic blood pressure can be explained by the predictor which is the age
coefficient is 1.09 which means every one year increase in the age there is an increase of 1.1 value in the systolic blood pressure
The second value which is constant is 86.2 this is the intercept and there is a significant value here as the P value is less than 0.05 from
a regression equation can be generated as the following.
Y= intercept + slope* X
 0:05:15
 0:04:34
 0:03:11
 0:03:41
 0:37:45
 0:23:42
 0:07:43
 0:13:09
 0:30:10
 0:02:29
 0:00:49
 0:18:08
 0:07:29
 0:01:48
 0:05:16
 0:06:37
 0:13:29
 0:26:22
 0:02:22
 0:00:55
 0:08:38
 0:00:50
 0:07:34
 0:03:23