filmov
tv
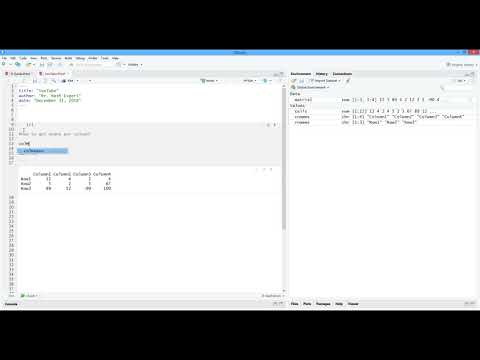
How to calculate column mean & mean for sub-groups in R or RStudio

Показать описание
This video shows you how to calculate mean for a category inside a given numeric variable. For example, calculating the mean age of women, calculating the mean age of individuals are men and were born in 2000, calculating the mean age of individuals who are women or who were born in 2000, etc.
How to calculate mean for a row or a selection of rows in R:
How to omit subjects with missing data, remove or ignore NA in calculations in R studio:
How to replace data values, including missing NAs data values in R or RStudio:
Please subscribe to my channel:
How to calculate mean for a row or a selection of rows in R:
How to omit subjects with missing data, remove or ignore NA in calculations in R studio:
How to replace data values, including missing NAs data values in R or RStudio:
Please subscribe to my channel:
 0:03:42
How to Calculate an Average in Excel
 0:06:00
Measures vs. calculated columns in DAX and Power BI
 0:01:08
Calculate Column Mean (Solution) | Automate Everything with Python
 0:26:32
How to calculate column mean & mean for sub-groups in R or RStudio
 0:02:33
How to Find the mean of a row or column in MATLAB
 0:03:33
How to Find the Mean | Math with Mr. J
 0:00:51
Calculate Column Mean (Exercise) | Automate Everything with Python
 0:14:34
Mean, Median, and Mode of Grouped Data & Frequency Distribution Tables Statistics
 0:35:25
MathsPositive Home Ed. Maths! - Data - Week 2! 🎉
 0:06:53
Calculate Mean of Data Frame Column in R (6 Examples) | mean, summarise of dplyr, colMeans & na....
 0:02:43
Excel VBA - How to Calculate the Average of a Column
 0:01:17
R : Calculate mean with a filter on a column's values
 0:01:46
R : calculate the mean for each column of a matrix in R
 0:09:02
How to calculate column mean for sub-groups in R Studio |StatForLife Channel|
 0:02:59
Performing a translation from a column vector
 0:05:55
Calculate Group Mean & Add as New Column to Data Frame (3 Examples) | dplyr & data.table Pac...
 0:00:50
How to Get Row Means and Column Means in R. [HD]
 0:01:06
27. Calculate AVERAGE Of Column | Power Query Editor
 0:01:00
Find Average mean of Grouped Data with Frequency Column on Scientific Calculator
 0:01:21
What is Water Column
 0:02:57
Calculate average in a column based on same value in another column in Excel
 0:01:21
PYTHON : How to calculate mean values grouped on another column in Pandas
 0:00:21
Set Multiple Column Values
 0:09:31
Calculating Conditional Average from Multi Column Data | AVERAGEIF ? No! It Will Not.
Комментарии